Mike Cohn, the guru at Mountain Goat Software, recently gave a webinar presentation to a bunch of PMI folks entitled "Agile and the Seven Deadly Sins of Project Management" [just click on the link for a free copy of the charts from Mountain Goat]
In an explanation of how agile fights information opaqueness, Mike presented a slide with a bar chart of team velocities and announced a 'confidence interval' as the main take away.
Gasp!.... I was shocked! shocked! to hear statistics in an agile discussion; sounds so much like management--project management at that. But, it's easy to tell that Mike is pragmatic, and confidence intervals are nothing if not practical.
Fair enough .... but actually there was no explanation given as to what entails a confidence interval. I'll correct that failing here.
First, an interval of what?
Would you believe the possible value of a random variable?
And which would that be? Answer: the sample average of velocity, call it V-bar.
And V-bar being a random variable, it has a distribution that prescribes how likely is any particular value of V-bar to fall into the interval of interest, ie, the confidence interval.
Second, we don't actually know the distribution of V-bar and we don't know the distribution of the population V (velocities), so we can't know what the next V is going to be, or its likelihood.
But, we know (from V-bar) an estimate of the population (V) mean. Thus, we can use V-bar as an estimating parameter of velocity, even though V-bar does not predict the next velocity value. (Example: average team throughput = V-bar x input units, like story points or ideal days)
Third, since we don't know, and it's not economic to find out what the distribution of V-bar really is, it's customary to model it with a distribution that has been tried and proven for this purpose--the T distribution.
The T-distribution is somewhat like a bell shaped distribution, except T usually has fat tails for small values of the parameter N-1 where N is the count of the values in the sample.
So what are the chances for V-bar, and how do you figure that out from the data given in Mike's chart?
I've reproduced my version of Mike's chart below; there are 9 velocity metrics ranging from about 37 to 25:
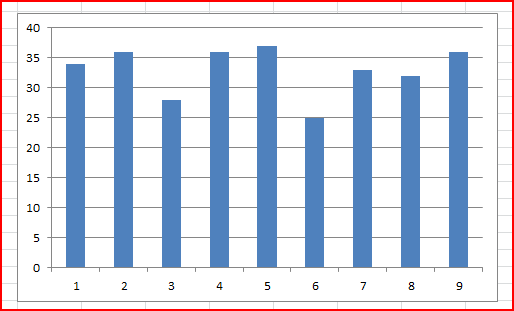
Here are the steps:
- Calculate the sample average V-bar, in this case 33, and the sample standard deviation, 4.1. Formulas in Excel will give you these figures from the 9 velocity points in the chart above.
- Look up the 't' value in a T-distribution table for N-1. N in this case is 9.
- Pick out the 't' value for 95% confidence [in t tables, it customary to look up a parameter labeled alpha; for 95% confidence, alpha = 0.05], in this case: 2.36 [there are formulas in Excel for this also]

- Calculate the interval around the center point of V-bar:
+/- t * sample standard deviation / sqrt(N)
+/- 2.31 * 4.1 / sqrt(9)
+/- 3.2
+/- 3.2
With just a little inspection of the formula above, and the t-tables, you'll discover that the interval gets wider as alpha is picked to be smaller [higher confidence]. In the limit, to have 100% confidence in the interval, the interval would have to very wide to cover every possible case conceivable.
Values in the velocity chart outside the interval are outside the quality limits of 95% confidence.
For reference, here's the model of V-bar, specifically the T distribution with N-1 = 8:
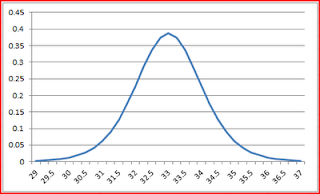
Values in the velocity chart outside the interval are outside the quality limits of 95% confidence.
For reference, here's the model of V-bar, specifically the T distribution with N-1 = 8:

Need more? Check out these two references:
Project examples for sampling and the law of large numbers
View more documents from John Goodpasture
And, check this out at the Khan Academy:
Read in the library at Square Peg Consulting about these books I've written
Buy them at any online book retailer!


Read my contribution to the Flashblog