
 Every two years the Standish Group publish a new CHAOS Report. These reports include classic CHAOS data in different forms with many charts. Most of the charts come from the CHAOS database of over 50,000 in-depth project profiles of the previous 5 years. You have probably seen some of those yellow-red-green charts showing e.g. challenged, failed and successful project percentages.
Every report contains an in-depth study regarding project performance. This CHAOS Report 2018: Decision Latency Theory: It’s All About the Interval presents the root cause of software project performance. A highlight of this report is their analysis and thought leadership what makes a project succeed with the winning hand and what makes a losing hand.
In the CHAOS Report 2018 are five main sections:
- Decision Latency Theory
- Winning Hand
- Classic CHAOS
- Factors of Success
- Skills of the Factors of Success
Decision Latency Theory
Decision latency theory states: “The value of the interval is greater than the quality of the decision.” Or with other words, if you want to improve project success, you have to speed-up your decision-making. The Standish Group studied this decision latency for over a decade and stated that a project will create one decision for every $1,000 in project labor cost. If it takes many hours to make a decision, there is probably a lot of overhead involved (e.g. escalating to higher management layers) and you will have difficulty to stay within time and budget. You have to find ways to reduce this interval by decentralize the decision making, by eliminating steps that take time but have no value, by killing many of those crowded useless meetings, et cetera. Simply reducing decision latency can improve your project performance by 25%. In the report several graphs are shows as well as tables with the cost of decision latency and the resolution (skill level) by decision latency.
Winning Hand
In the previous CHAOS Report 2016 the five cards of a winning hand for project success were introduced:
- First card: The project needs to be small
- Second card: The product Owner or sponsor must be highly skilled
- Third card: The process must be agile
- Fourth card: the agile team must be highly skilled in both the agile process and the technology
- Fifth card: The organization must be highly skilled at emotional maturity
As long as I have seen output from CHAOS reports, the project size and a committed project sponsor were always in the top 3 of their factors of success. For each card you get a graph showing the effect on challenged, failed and successful projects (effect of project size, effect of good sponsor, effect of the agile process with skilled teams, effect of using skilled teams and the effect of emotionally mature teams). And, as you can imagine, a combination of cards will increase the chance of project success, definitely when you are highly skilled at decision latency.
Classic CHAOS
The CHAOS database includes six individual attributes of success: on budget, on time, on target, value, on goal and satisfaction. The Standish Group started with a traditional metrics of success by looking at: “on time, on budget, and on target”. This means in this CHAOS Report 2018 for the year 2017: successful: 36%, challenged: 45%, failed: 19%. If they use their “modern” definition of success: “on time, on budget, with a satisfactory result.” You get almost the same results (33%, 48%, 19%).
In this report we get a new definition of success that they call “pure success.” Pure success is the combination of high customer satisfaction with high return on value to the organization. Related figures for the year 2017 are: successful: 14%, challenged: 67%, failed 19%.
Another table with figures that is presented shows the resolution of strategic goal (precise, close, loose, vague, distant and failed) versus value management (very high value, high value, average value, low value and very low value).
For each of the five cards we get a table with percentages for successful, challenged and failed. Tables for resolution by project size, resolution by project sponsor skills, and resolution by method. If you are using agile or non-agile and the project size is small the outcomes are more or less the same. When increasing project size an agile method becomes more successful. Looking at team technical skills you get two tables. One showing a four-point range and the other a five-point range of skills.
This part is finalized by looking at project resolution by industry where banking shows the highest and telecon the lowest percentage of successful projects and by project type (developed from scratch … purchased application of the shelf).
Factors of success
Every year since 1995 the Standish Group creates a list of 10 attributes and their relative weight that they call the factors of success. The top three for 2018 are decision latency, minimum scope and project sponsors. For each of the ten factors you get an explanation and a table showing percentages of successful, challenged and failed related to resolution of the specific factor (e.g. skill level).
Skills of the Factors of Success
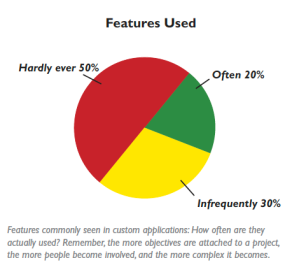 For each of the factors of success you get a set of five skills that help to improve that factor. E.g. if you look at decision latency you can use the following skills to reduce decision latency: reducing decision latency reduces the interval between decisions, make quick decisions, distribute decisions, rapid consensus, and decision pipeline. Or if you look at minimum scope one of the skills to promote minimum scope is a simple vision. Of the features available to most mission-critical applications, 20% are used “often,” 30% “infrequently,” and a full 50% are used “almost never.” In total you get 50 skills that not only improve latency but can also be implemented at very little cost.
Conclusion. CHAOS stands for the Comprehensive Human Appraisal for Originating Software. It’s all about the human factor. If you are looking for areas of improvement of your organizational project management skills, this guide gives a great overview where you could get the highest benefits from your investments. It gives excellent insights in root causes for project failure or success.
To buy this report: www.standishgroup.com/store/


Pingback: El tremendo coste de la indecisión | Gestión de proyectos ágiles
Hello Henny,
I want to know if there is no new Chaos Report since 2018? I looked in the Standish web page and I cant find any,
Thank you and great post!
Anabel
If you click on the link in my post you see: Chaos 2020 beyond infinity.
Pingback: Why 47% of Agile Transformations Fail! – Technology Revolution
Pingback: 7 Wastes in Lean Software Development – CoTransition
Pingback: Why do 47% of Agile Transformations Fail? - PM 360 Consulting
Pingback: System Theory | Newperspektif