Kanban planning is popular amongst project management offices (PMOs) because it’s easily integrated with various project management methodologies. Similarly, Gantt charts are widely used as they are the ideal accompaniment to different kinds of planning methodologies. It is the features and principles of Kanban boards and Gantt charts which also make them a perfect project management pairing. And a hybrid system of the two may be worth implementing in your next project.
Here we’ll give a brief background about each system, how they are implemented and the basics. Plus, we’ll provide some examples of how to get the best out of both.
Kanban Vs Gantt: Overview
Unless you’ve been living under a rock for the past 20 years (no shade if you have been, but I might have a few questions…), you’re probably well aware of the virtues of both Gantt charts and Kanban board planning.
Designed to simplify and streamline workflow, Kanban boards have made the jump from manufacturing to IT to academia and anywhere else in need of a systematic project planning and management technique.
Similarly, Gantt charts are a popular tool as they deliver an accurate picture of your plans, while helping to organize and manage your work assets.
Both tools are great and have their pros and cons. So what if you can just pick the pros from both? Then you could create a PM system which melded the simplicity of Kanban with the accuracy of Gantt charts. While still containing the visibility of the two. Maybe the perfect mix.
Keep reading to find out Kanban Gantt project management combines the best aspects of both. How it lets you create a management system that fits your specific work style. And how to get started. A quick review first…
What is a Gantt chart?
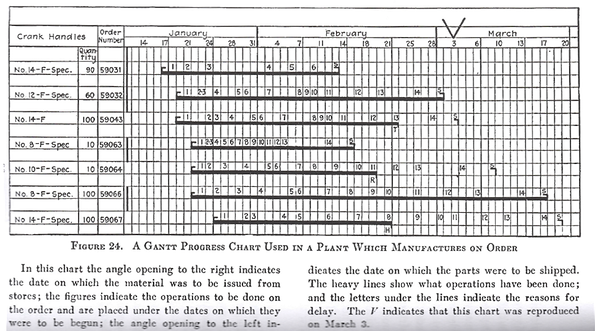 An early Gantt chart example.
A variation of the bar chart, Gantt charts showcase your project progress, timeline, and dependencies. All in a highly visual and easily understandable package. It’s no wonder why today, Gantt charts are “one of the most widely used management tools for project scheduling and control”.
Developed more than a hundred years ago, and going through numerous iterations, it was finally Henry Gantt’s chart that has become the eponymous version we know today. And with the advent of computer technology, Gantt chart software was developed that made constructing one of these a quick and painless process.
Trivia: Gantt charts were revolutionary 100 years ago. And although Karol Adamiecki first developed the chart in 1896, he didn’t publish until 1931, missing out to Mr. Gantt. When they were first published the charts were used in construction. But were also prominently used during WWI by General William Crozier. Showcasing just how versatile the tool has always been.
How to use a Gantt chart for project management
Because of its visual nature, project management via a Gantt chart revolves around its core features. Schedule your projects and their corresponding tasks and projects, while getting an overview of the entire project process. Gantt charts create a work-breakdown structure (WBS) and deliver your projects on time. While also staying flexible and agile.
The core features of a Gantt chart which help with project management are:
Timeline – the backbone of the chart. It is against the timeline where you can see how your activities (projects and tasks) are progressing, and which resources are utilized in the process. Modern Gantt charts actually allow you to zoom in and out of your timeline, making it easier to plan both in the short and long term.
Gantt chart bars – these bars are a visual representation of your projects and tasks. Not only do they demonstrate the length of time, but if you use your Gantt chart as a resource planner, then you can also see who or what is engaged in that task.
Resources – Resources are what make your projects tick. They are the people, machines, and equipment which bring projects to fruition. Assign resources to tasks and see who’s engaged in what, who’s in need of some helping hands, and who needs some additional work to do.
Dependencies – Not only can you see the associated tasks of a project, but Gantt charts show you how these tasks are linked together. And what order something needs to be done for the next one to start. By connecting a project’s tasks, you add to the WBS and set your team up for more success.
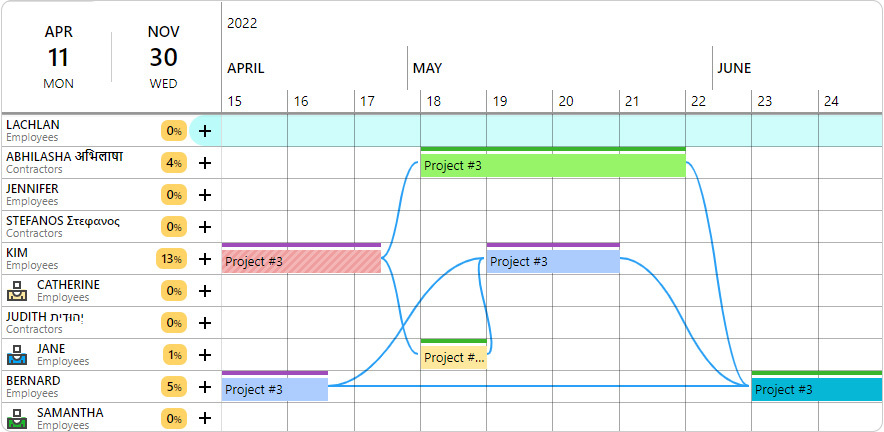 A Gantt chart created in Ganttic. Here you can see the different tasks, resources, and dependencies attached to the projects against the background of the timeline.
Gantt chart software today
Gantt charts give a visual overview of your project. You can see how your project’s tasks are progressing, what your resources are engaged in, and a concrete start and end date. This makes it not only an ideal tool for PMs, but also for the teams working on the plans, who can see exactly what they need to be working on. As well as for stakeholders or clients who need a rundown of progress.
It’s simple to create a Gantt chart using your favorite work tools. For example using Excel or even Google Calendar.
To make it even better, a lot of online Gantt software gives additional project management capabilities. Which help you get the most out of your resources or see things in a new way.
Some of these include:
- Customization and coloring options: Add your own visual spin and create the right cues for instantaneous insight.
- Drag and Drop scheduling: Forget hand drawn resource allocation. Instead, schedule new tasks in 2 clicks. Or reallocate tasks that need some extra support.
- Dependency lag time: This lets you input a specified lag time between dependencies. So if something goes longer than expected, your project will suffer less bottlenecks.
- Utilization tracking: See how little or how much your resources are working and how much effort your tasks take. This helps with efficiency and can keep your projects lean.
- Custom data fields: Assign the right task to the right resource. Or filter and group by specific data. The best of these features let you add in any info you need, and not restrict you in the process.
What kinds of project management methodologies can you use with a Gantt chart?
Short answer: Any and all.
Longer answer: Whether you prefer traditional methods like waterfall, or want to keep it lean and agile, or maybe change management is more your style. Gantt charts have the ability to fit squarely into your project management methodology.
Flexible, transparent, and visual Gantt chart makers can be adapted to the way you organize and manage your teams, resources, and projects.
And this is one main reason why a Gantt-Kanban approach is not only doable, but preferable for PMs. Let’s turn now to Kanban management to see how to make that happen.
What is Kanban?
Originating in Japan’s Toyota Production System in the 1940’s, Kanban was originally developed to improve manufacturing efficiency. The name itself translates to sign board, referencing the visual nature of the boards.
In the early days of its implementation, literal notecards represented the various tasks. In the image below, you can see how the original Kanban view looked. With the physical notecards being moved around manually as the task progressed.
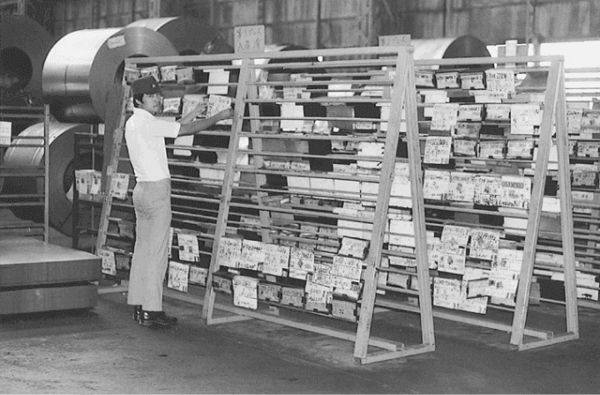 Source: TOYOTA Global Website
Beginning in the early 21st century, Kanban was adopted by IT companies as the PM trend was shifting towards more agile and lean management practices. As such online Kanban boards have become a popular tool with PMOs. Not only in IT, but in every sector and industry.
Trivia: Kanban comes from a mix of 2 Japanese words, Kan 看 meaning sign and Ban 板 meaning board. The idea itself came from a 400 year old Japanese tradition of custom designed shop signs, that business owners used to advertise their wares and compete with one another. As competition grew, these signs and their designs got more elaborate. This practice can be seen in current day Japan with the practice of neon signs.
How to use Kanban for project management
The idea of Kanban is simple. As it pares down all its project management elements into an easily understandable and streamlined system. The most basic board contains just a few elements, which help zero-in on your work activities without distractions. These include:
Kanban board columns: These denote project status categories. The most basic of which include: requested, in progress, and completed. But these can be broken down into additional categories, such as work in progress that is awaiting review or which is interrupted.
Kanban notes: These can be physical note cards or sticky notes. Or if you use Kanban software, virtual indicators. The notes can simply include project tasks. Or they can get more in depth and provide dates, information about who was assigned the task, and handover info.
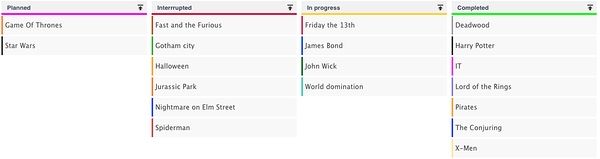 A simple Kanban board created in Ganttic. Here we see which projects are still in the planning stages, which are in progress, and what one’s have been interrupted, and which have already been completed.
These elements are all you need to create your own Kanban board online or on a whiteboard. Although there are boards which go into more detail. As such you may come across some of these additional Kanban board elements:
Work in progress (WIP) limits: This number denotes the maximum amount of work allowed to be present in the different columns at once. This limit helps to ensure a balanced workflow. By restricting the amount of work items being undertaken at a given time, you can create a better workflow and keep utilization in check.
Swimlanes: Horizontal lines which separate your board into different kinds of work. For example into teams, departments, or different products.
Whether you decide to keep your board basic or you choose to take it to another level, it’s clear what benefits Kanban boards can provide. They create a real-time information repository and visual overview of your projects and portfolio.
But how do they work alongside other project management systems? Let’s find out!
Kanban Gantt project management in Ganttic – the best of both worlds
What happens when you combine two of the most popular project planning methodologies? You create a hybrid system that is the best of both worlds. Below are 4 ways you’ll see improvement if you decide to implement a Kanban Gantt project management approach.
Get a different view of projects
Both Kanban and Gantt give a bird’s eye view of your projects. But sometimes to get something right, you need to take a step back and look at it in a new way. Melding these tools into a singular piece of online project management software allows you to just that.
Plus, they use the information you’ve inputted. And saves you the hassle of entering data in twice. Making it a simple and fast way to find some inspiration.
ProTip:
In Ganttic, you have a default view of your projects which you can see on your Gantt chart. But, what if you want to dive more in depth?
In that case, take a look at your projects from the Project List. There you can switch over to Kanban, to see all your planner’s data organized in a Kanban style. Using your pre-existing List-type Project Data Fields, you’ll get a rundown in a brand new way. Organize the Kanban board by Project status, department, project manager, or any other criteria you may want.
This is an easy and effective way to see what’s happening in your projects. If you don’t like what you see, then just use drag and drop to move things around. Until it’s exactly the way you want.
Better for managing multiple projects

Kanban keeps it simple. But if you want an overview of your project portfolio, things can get messy. Unless you’re working with multiple boards or multiple swimlanes, it can be difficult for the PMO to get one overview of the entire portfolio.
Adding to that, It can be hard to establish a hierarchy with Kanban. Meaning it can be harder to execute that PPM strategy.
But if you merge with Gantt charts, then you can create your own hierarchy. Create a basic overview in your Kanban boards, or simply use them for singular projects. While in your Gantt charts, establish your dependencies. And fit your projects in amongst the right resources. Get a more accurate picture of your long term strategy and plan for potential hiccups along the way.
When managing multiple projects, don’t forget to track utilization. This metric will ensure you aren’t overworking those resources, and is especially important if you’re sharing resources with other PMs. Find out more about resource utilization and how to use it in a smarter way.
Concrete planning timelines
A Kanban Gantt amalgam is perfect if you want some concrete planning times. Deadlines, milestones, handover times, all of this is lacking on basic boards. And sometimes it can be overwhelming to include this info on the simple design. Especially your goal is to pare down on the information overload.
But mixing the two you can see exactly when projects will end. Just open a Single Project View, which will give you a Gantt chart timeline. This way you’ll have a concrete date for your client or boss, all while keeping your Kanban board lean and lessening data distractions for your team.
Tip: In Ganttic you can open each View in a different tab within the app. Making it easy to flip between Gantt charts, Kanban boards, and Calendars.
Make your Kanban board meaningful to you
We know that the classic Kanban contains info on pipeline projects, those in progress, and completed projects. But what if you wanted to categorize tasks according to location? Or project coordinator? Or any other data that helps you plan?
Well in Ganttic you can! Kanban boards can be created from your project’s list-type data fields. So if you have information about your team’s location that you want to categorize in a Kanban style, it’s possible. For example, you see that your team in Singapore has more on their plate than your Indian branch? Drag and drop and do some reshuffling.
This creates a board that’s more meaningful to you. And if it’s applicable to how you, it ensures that you’ll keep using this system.
ProTip:
Online Kanban Gantt management a great strategy for managing your dispersed teams.Because you’ll be able to see exactly what your different branches are working on and how many projects are on their plate at one time. Who’s got too many projects in the interrupted column? Who’s crushing those completed projects? With Kanban this information is easily conveyed. And is an alternative view to your timeline. Remote project management just got easier with a Kanban-Gantt tool.
Get an online Kanban view in Ganttic
If your goal is to create project management software that works for you, we get that. At Ganttic, the goal for the past 10 years has been to create the most flexible planning and scheduling platform available. With our recent update, we’ve added Kanban boards to our toolkit. Making your planner even more tailored to how you work.
Whether you’re looking to get a different angle on your plans. Or you’re hoping to gradually implement some Kanban elements into your existing system. Give them a try.
Currently you can use Kanban boards in your Project list views. If Kanban is something you’d like to see implemented in other parts of your Gantt planner, let us know!
If you want to see for yourself how they work, but don’t have Ganttic, sign up for a free 14 day trial. And plan the way that works for you.