Building a Successful Team using Hub Planner Resource Management Analytics
How to build a successful team using Hub Planner’s Resource Management analytics? Hub Planner is the leading resource management software helping teams with scheduling and project planning, tracking time and reporting the data. So, with all the information that Hub Planner holds about resource management. Why not use that valuable information and help with building a more successful team?
Hub Planner provides the resource management data you need to make great decisions.
There are many signals in analytics that help us understand and measure how the project success and team performance. Hub Planner helps to foster better team collaboration and is accessible to all stakeholders. Using the resource management analytics right in front of you, will help you make more informed decisions and keep your team on track. As all data in Hub Planner is real time, it gives you the platform to make instant strategic decisions now, instead of waiting for a project to finish. Let’s make your team a high performing team.
How Hub Planner helps build a successful team using resource management analytics?
Hub Planner has most definitely delivered on the resource management analytics. We have quality data here, let’s not waste it. Let’s step back and assess the analytics. What are the key elements to understand? Hub Planner provides a framework that helps you quickly view how a project is performing, if you are on budget, how well teams are performing and being utilized. Let’s use this data to better our Resource Management which can be based on valuable data driven insights.
How to utilize all the resource management analytics that Hub Planner has to offer?
Hub Planner encompasses many different features and functions for resource management. How do we best utilize the resource management analytics so that we can benefit more, schedule better, earn more profit, make better decisions and build a more successful and high achieving team? Let’s have a look at what to use and how to use them.
Reports
Hub Planner Reports are a high performing engine helping teams to build and create efficient and quality Project and Resource reports. When building a successful team, we can use Hub Planner reports to analyze resource management analytics with powerful instant insights into Projects, Resources, Utilization, Spend and Budgets. Real time report information allows for making smarter and strategic decisions in future planning and forecasting. Hub Planner has 70+ predefined report templates to get you started. Create custom dynamic reports from scratch by using the clever Report Builder.
How to use resource management analytics from reports
Reports will allows us to deep dive into the resource management analytics, where as the Hub Planner Dashboard will provide you with ‘pretty pictures’ of the high level stats on resource, project or team data. How the scheduled verses actuals went. How is the budget is performing? Are we utilizing the team enough? We can deep dive into the nitty gritty of the resource management data, but we can also scale out to provide us with a snapshot, a more high level view of teams and projects. In doing so will help us make better scheduling, planning and resource management decisions which, in turn, will help with building a more successful team. Not only that you are gaining so much from your investment into your chosen resource management software. There are 70+ pre-formatted smart templates grouped into distinctive, easy to navi folders which leads to the report templates.
Hub Planner cleverly has a report builder which is super powerful in building your own custom reports. The report builder is so easy to use with the step by step process. Broken into 6 sections, like so:
| Report Builder | Description |
|---|---|
| Type | Choose from a Project, Event, Resource or Unassigned Work report |
| Data | Based on the type, who are we creating the report on. For example, a resource type report on all Active Resources in the system. |
| Date Range | Select the range of dates that the report should apply to. |
| Filters | Apply filters like Booking Categories, Custom Fields, Reported Time state, etc. |
| Columns | With over 200+ options to choose from, select the options you would like to see in the report. For example, scheduled time, reported time, and forecasted utilization. |
| Grouping | Multiple options to group the report. Add a secondary grouping allows you to break out the report data further. For example, Group by Resource and then by Project. |
Report Toolbar
The report toolbar provides you with multiple quick access functions to adjust the report or extend the features of it. For example, remove report results with no data for the date range, or switch the data to show days instead of hours etc. Choose to export, chart or save the report you built. Teams can save created reports to an Internal folder for team access or privately too.
Each report will allow you to navigate further into the resource management analytics. By clicking on one result, you can navigate up to 4 levels of further details about that result.
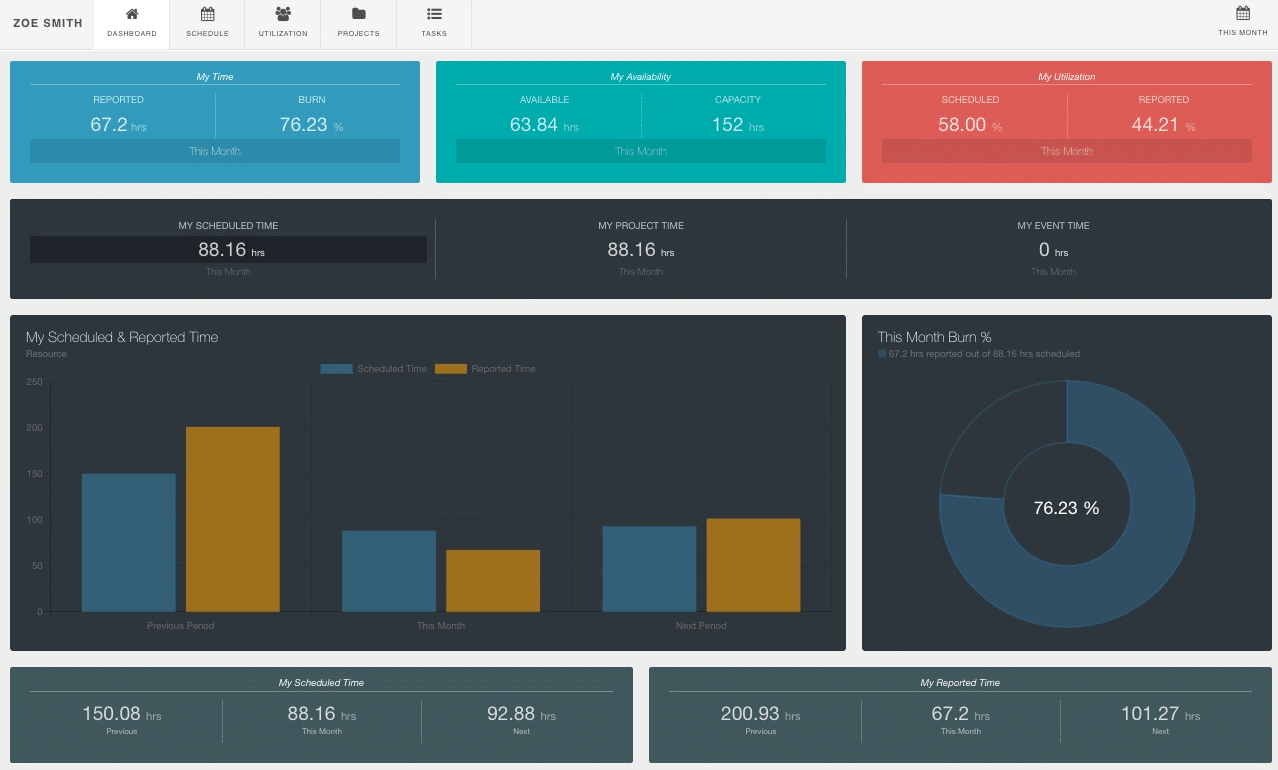
The Dashboard
The Dashboard is a home page that displays key metrics and important resource management data about a team, project, resource or project group. Select a dashboard of a resource, a project, a team or a project group. Each will vary in terms of metrics available. Project dashboards will detail some financial elements whereas a resource or team dashboards will focus on time, utilization rates and burn data over different time periods. Resource management data analytics are grouped into pods detailing specifics and displaying corresponding metrics to compare against. For example, show the scheduled versus actuals against the previous and next time period. What’s more, there are inline tabs to each dashboard that will further detail the timeline schedule, the utilization, projects and tasks of the resource, project, team etc.
Resource Dashboard
Resource dashboards will quickly display time as scheduled versus actuals. Show you the data over adjacent time periods. What you had planned and what was reported. Display the resource burn rate, how much time is available, etc. How well resources are being utililized with an added inline tab showing the utilization rates in further detail. Show the timeline of the scheduled bookings and what booking categories are allocated. What tasks are assigned to the resource on the backlog v completed. Looking at the stats, how can you improve them for the next project or the next timeframe? Do you need to intercept now to make a better outcome? All of which go towards building a successful team.
Project Dashboard
When it comes to looking at a project dashboard, we will show the high level stats of a project or indeed a project group. How the budget is performing? What’s the project burn looking like? We can use the inline tabs to delve into the timeline of the project schedule as well as the utilization rates of resources working on the project. Switching through pre formatted date ranges allows us to compare and contrast data.
Skill Sets, Locations, Expertise and more via Custom Fields
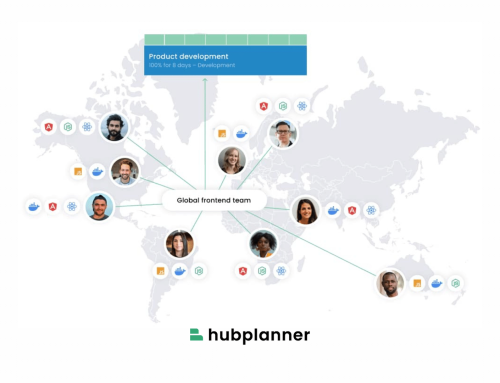
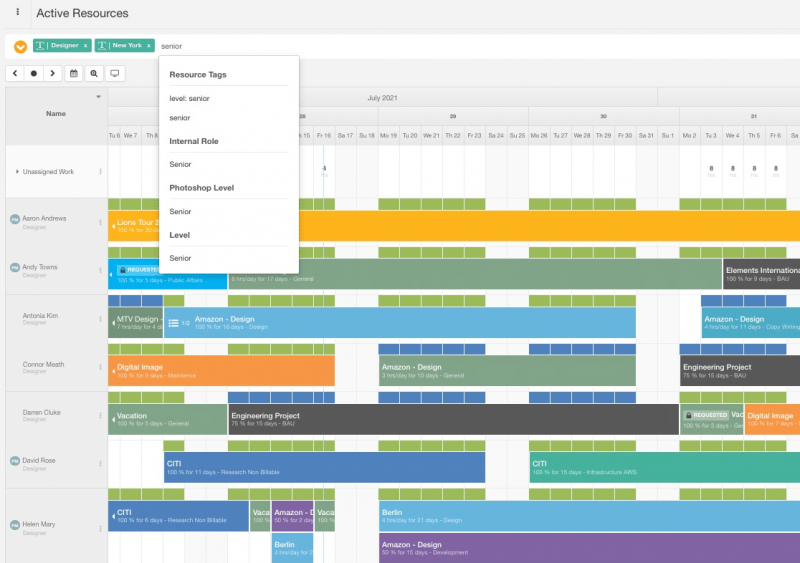
Hub Planner has a really popular feature called Custom Fields. This allows you to create your own industry jargon related data that makes sense to you. We can set custom fields on Projects, Resources and even bookings. When it comes to resource management and project scheduling, we can use custom fields to help match the right resources with the right projects. For example, based on team skill sets. We can search the team scheduler for a custom field and the scheduler will filter the team based on the search criteria. This is a great way to find out who’s available based on a skill set, or location, etc.
Show me all Designers, based in New York, who are really good at Photoshop?
When it comes to resource management analytics, we are able to report on project bookings and resource allocations based on these custom fields. So you can imagine the level of resource management data available for us to use here. Whats more is that you can build different resource teams based on custom fields using smart groups. This can only add to the success of a team.
See example of the Active Resources Schedule below. Use custom fields to locate available resources based on skill set, location, level of seniority etc. Simply type the skill sets you need in the search bar and watch the scheduler filter out resources who meet the conditions you set. You can also click the drop down to select the custom fields required.
Using this feature will help us identify any gaps in our skill sets, do we need to hire more contractors to bridge the scheduling gap we have. Are we top heavy on any locations that can help other locations. Why do my Frontend Developers in London report so much overtime? Why are there so many Priority 1 projects? All the custom data to enter into Hub Planner is available on reports. Build the reports to help guide you to answer these questions. In turn, build a high performing team.
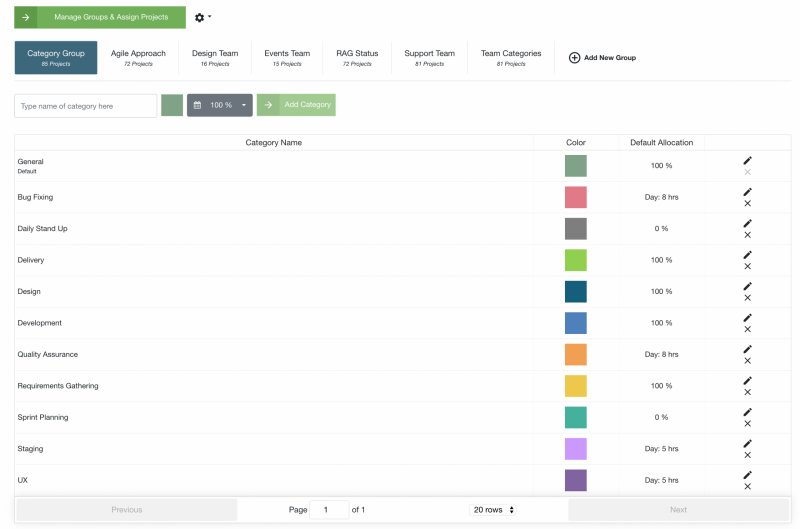
Booking Categories
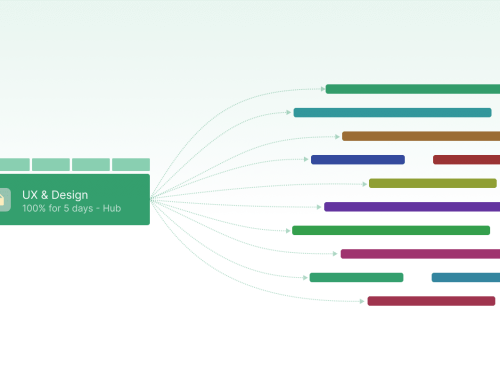
What are booking categories? As previously mentioned, we can schedule a project booking and resource bookings. Booking a team member on a project, this scheduled we refer to as a booking. Call it a project booking or a resource booking. With that said, when scheduling, we can also apply a booking category. What does that mean? It means you can tag a booking to help identify what the team member is working on within that project booking.
Instead of Abbie working on the Amazon project, let’s say Abbie is doing Design Work on the Amazon project. This helps us define what exactly Abbie is doing. Not only does this help ascetically for organising and forecasting the schedule, it helps us with our resource management analytics too and in turn helps to building a really successful, high performing team. You can see in the previous image of how the schedule will look when we allocate colors and details to the booking categories. We can analyze time spent by booking category by project and resource time.
How booking categories help with building a more successful team?
What’s more, we can also create booking category groups. Here, we can determine different groups of booking categories and assign the relevant projects to the groups. This way, depending on what project I schedule will determine what booking categories I see. For example, scheduling a design project, I will see the design related booking categories. Whereas, scheduling an engineering project, I will see the relevant engineering related booking categories. So this is super helpful with a diverse team with multiple disciplines.
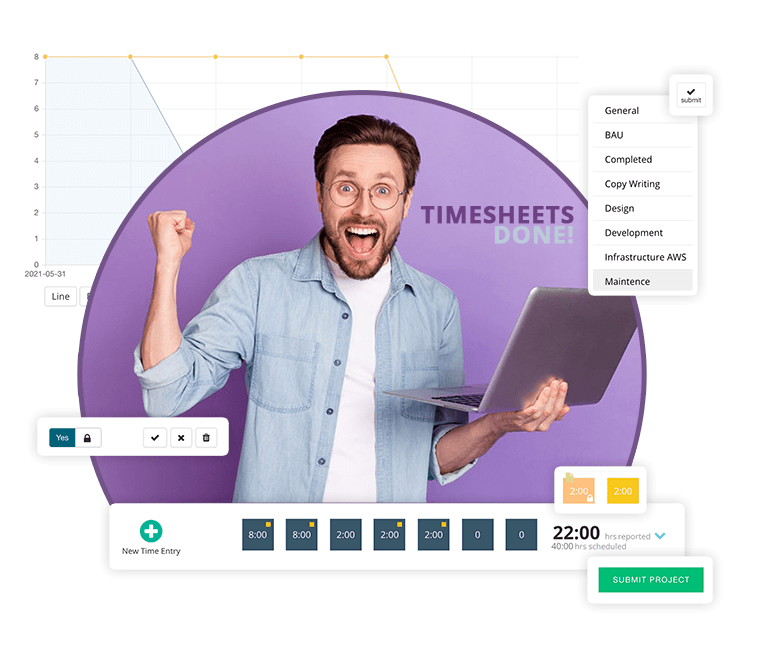
Scheduled v Reported
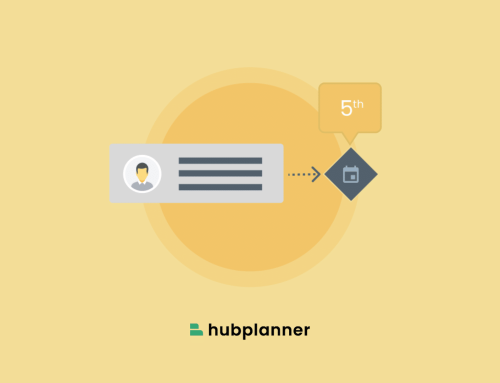
Timesheets helps us capture data from the resource and what they actually reported against a project instead of what was scheduled. This is key to identifying the scheduled v actuals. In turn, this will help us in our scheduling process whether it’s for next week or the next project. We can also capture the booking category details that will really help with our resource management analytics and seeing where time was actually spent. Options to add time entry notes too can be helping in detailing more information about the recorded time.
The design of timesheets is imperative to the success of a team recording time. The UI needs to be clear, straightforward and easy to use. Here, the more accurate details of resource management analytics we obtain, the more successful we can become. We will use these analytics to base our next decisions from. Therefore it’s key that teams are filling out their timesheets properly. The system will detect if there are any timesheets left to be completed, if so, the system will trigger a quick reminder to the teams to remind them. When it comes to viewing team analytics, there are copious column types we can add to reports. For example, scheduled time v reported time, burn rate, time entry status, time entry notes etc. There’s even a template called ‘Who’s behind on Timesheets’!
Billing & Spend
Whether you set both internal and external rates, apply to resources, custom booking rates, Hub Planner looks after all project and resource billing and budgets. Hub Planner allows you to set budgets and also set billing rates on multiple levels. Set billing rates at a project level, resource or even a booking. Activate the billing and budget panel when viewing a single project within the scheduler. The billing and budget panel can detail everything you need to know about the project and resource spend, the project budget, scheduled v reported time and spend etc. All in real time, so when anything is updated, the financials will auto update. This is consistent throughout Hub Planner when it comes to updating the dashboard, the scheduler and the reporting aspects. The Project Dashboard will detail where the budget is at, how much has been spent so far and what’s remaining.
Show me projects over budget?
Use the Billing and Budgets report analytics to build a successful team.
Theres even a dedicated report folder set to Billing and Budget, filled with pre-formatted templates like Budget Reports, Resource and Project Profitability, Scheduled v Reported Spend, etc. Viewing billing data over a report heat map, add conditional formatting, using filters to only show results with project profitability over 10k etc. Hub Planner reports really do provide those enterprise level features to customers.
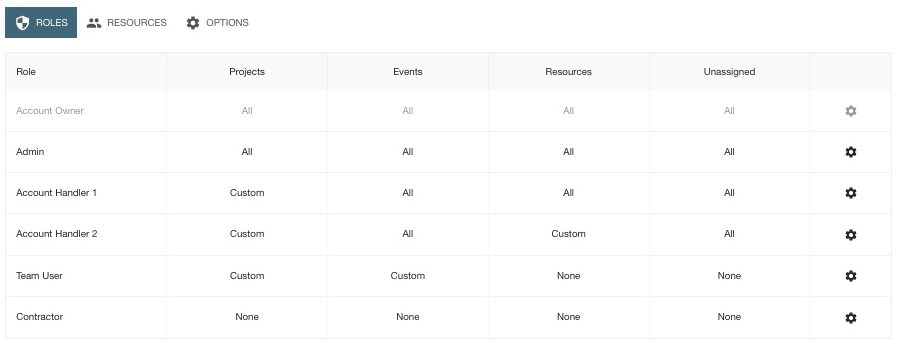
Role Permissions & Rights
Analytics are accessible to all stakeholders. Hub Planner Permissions and role right settings allows us to share the right data with the right stakeholders. The reports will filter to each user based on their user access and role rights. Aa will the scheduler, timesheets and all features of Hub Planner. Set the role rights of users too which will help to manage who has the ability to action. Whether it’s role right to edit a project or schedule teams, there are multiple role rights available for each of the role types.
Building a more Successful Team using resource management analytics
So, do you think Hub Planner can help you with building a more successful team using resource management analytics? Why not try us out? Hub Planner offers a 30 Day FREE Trial. See for yourself how you can help to make use of team and project analytics to build a better team.
Schedule a call with one of our experts who can help demonstrate how to build a better and more successful team based using Hub Planner.