Let’s say you awarded a contract of $1M to a vendor to deliver a critical component for your project. The contract with your vendor is set up with a fixed price, but you have incentivized the contact to get a better-quality component with good performance. As the manager of the project, you are currently witnessing cost overrun for this component. The overrun has not yet hit the final, fixed price yet, but the vendor is saying it is likely to go beyond it.
Now, as the project manager, a number of questions are bound to come up. If it is not you asking, your sponsor(s) and/or key stakeholders may be, and the most likely questions at this time are as follows:
- How much will be owed if there is cost slippage?
- Will you pay when the cost slippage becomes more than $1M (or an amount above the contact price)? If so, to what extent beyond?
- At what point will you stop paying anything to the vendor and hold them responsible for further cost escalations? In other words, will you let the contract become a pure fixed price contract?
All these questions lead us to a concept known as Point of Total Assumption (PTA). To understand PTA, we will first look at some basics in procurement management. These are quite foundational and easy to understand, but important as we proceed further.
If you are aspiring to be a Project Management Institute® Project Management Professional (PMP)®, you will need to fully grasp this concept, as questions on PTA can come up on examinations.
Price, Cost, Profit, Incentives
In any contract, there are usually two parties, the buyer and the seller. The buyer obviously pays the seller to purchase an item. The buyer pays the price for the item purchased, but there are differences among price, cost, and profit.
The formula combining them all is this:
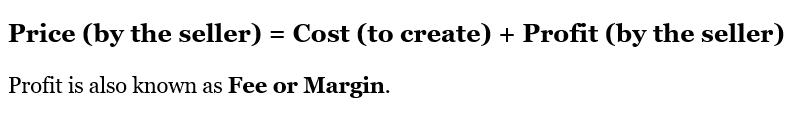
Let’s say you bought toothpaste for US$10. This is the price you pay to the seller, not the cost of manufacturing the toothpaste. The cost for the seller to manufacture the toothpaste may be US$8, and hence, their profit becomes US$2. In such a case, the following is true:
- Cost = US$8
- Profit or Fee = US$2
- Price = US$10
Of course, items like toothpastes are commodities, but these concepts of price, cost, and profit still apply.
Another term to consider in contract management is incentives. Incentives come into play because sellers are mostly focused on profit. Buyers are more focused on cost, schedule, quality, performance, etc. Incentives help bring together the objectives of the seller, as well as the buyer. An incentive motivates the seller to put forth the best effort designed by the buyer where efficiency is needed. Types of incentivized contracts can be:
- Fixed Price with Incentive Fee (FPIF)
- Cost Plus Incentive Fee (CPIF)
- Cost Plus Award Fee (CPAF)
Point of total assumption (PTA) is applicable for Fixed Price with Incentive Fee (FPIF) contracts. I will say more on that shortly.
Terms Related to PTA
First, let’s understand the terms of price, cost, and profit in the context of incentivized contracts. In the case of incentivized contracts, the terms used are target cost, target fee, and target price, respectively. You see, you are incentivizing the contract, and therefore, you are pre-pending the terms with the word, target!
Target price, target cost, and target fee are the ingredients of a FPIF contract, and with these, we derive a formula for PTA. We will see this shortly, but first I’ll define the terms we are considering:
- Target Cost (TC): The amount taken by a seller to create or develop an item.
- Target Profit or Margin or Fee (TF): It is the margin taken by the seller on top of cost.
- Target Price (TP): Target Price is very similar to price, but used for comparison with Final Price. It is the measure of success. The formula for TP is Target Price (TP) = Target Cost (TC) + Target Fee (TF).
- Buyer Share Ratio (BSR) or Share Ratio (SR): Sharing Ratio describes how cost savings or cost overrun will be shared between the buyer and seller. For example, 80%:20%. The first percentage is for the buyer, and the second is for the seller. For every $1 cost overrun, 80 cents will be paid by the buyer and 20 cents by seller.
- Ceiling Price (CP): Ceiling Price is the highest price the buyer will pay. In other words, profit for the seller at CP is minimal because by that time, a cost overrun has happened. The CP is typically 115% to 120% of the Target Cost.
- Point of Total Assumption (PTA): It is actually the point of total cost assumption or the cost beyond which the buyer will not pay a cent more to the seller.
With these basic definitions in mind, let’s get deeper into the definition of PTA, the formula to calculate the PTA, and an example of PTA hopefully providing further explanation.
PTA Definition
Point of Total Assumption can be defined as follows:
“Point of Total Assumption is that point during cost overrun where the ceiling price of a fixed price incentive (FPI/FPIF) contract has been reached. At this point, the FPI contract converts to a firm-fixed price (FFP) contract.”
To elaborate further, these statements are characteristic of PTA:
- PTA comes into play during cost overrun of a contract.
- When we talk of PTA, it is actually associated with cost. Hence, a default PTA term can also be called “PTA Cost” or even “Point of Total Cost Assumption.”
- At the PTA cost, the ceiling price (CP) is reached. Hence, “PTA Cost” is also known as “Ceiling Cost.”
- With cost overrun and before PTA, there can be various sharing ratios between the buyer and seller, as negotiated. Beyond PTA, the sharing ratio (or buyer sharing ratio) is ALWAYS 0%:100%.
- Beyond PTA, the FPIF contract converts to a firm fixed price (FFP) contract. After all, at PTA cost, the ceiling price is hit, and beyond this price, the buyer won’t pay anything at all.
PTA Formula
As we know, PTA is for cost overrun. This cost overrun happens when the cost is obviously above the target cost. Hence:
Cost overrun at PTA = PTA cost – Target Cost
At PTA, the buyer’s share of cost overrun will be:
(PTA Cost – Target Cost) × BSR
The total price paid by the buyer to the seller will include this share amount, too. Hence:
Price at PTA = Target Cost + Target Fee + (PTA Cost – Target Cost) × BSR
We have seen earlier when exploring the basics of procurement management that:
Target Price = Target Cost + Target Fee
Using this in the above equation, we will get:
Price at PTA = Target Price + (PTA Cost – Target Cost) × BSR …. [1]
We also know that when PTA cost is hit, the ceiling price is reached. In other words, when PTA is reached in the cost curve, the price curve will hit the ceiling price (PTA price equals ceiling price). Hence:
Price at PTA = Ceiling Price …. [2]
Considering both equation [1] and equation [2]:
Target Price + (PTA Cost – Target Cost) × BSR = Ceiling Price
=> (PTA Cost – Target Cost) × BSR = Ceiling Price – Target Price
=> PTA Cost – Target Cost = (Ceiling Price – Target Price)/BSR
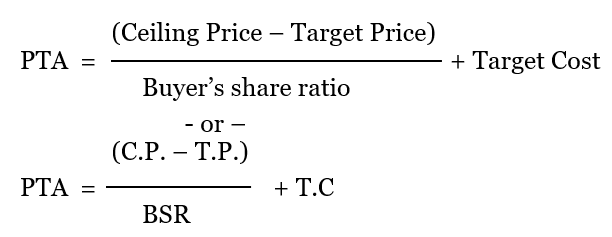
=> PTA Cost = (Ceiling Price – Target Price)/BSR + Target Cost.
“PTA Cost” as we know is the default PTA term. Hence, the formula for PTA will be:
An Example
Let’s consider an example to get a better hold of the PTA concept. Remember, when I am saying PTA, by default, I mean “PTA Cost.”
Let’s say that in a contractual agreement, the buyer and seller agreed to a cost of $300,000 and a profit of $30,000. The buyer has informed that the ceiling price will be $360,000. Beyond the target cost, the sharing ratio between the buyer and seller will be 60%:40%.
What is the PTA? To solve this question, first, we need to assign values to the various components:
- Target Cost (TC): $300,000
- Target Fee (TF): $30,000
- Target Price (TP): $300,000 + $30,000 = $330,000
- Sharing Ratio (SR or BSR): 60:40
- Ceiling Price (CP): $360,000
Now, the PTA is as shown (by applying the formula):
= [ (C.P – T.P) / BSR] + T.C
= [ ($360,000 – $330,000) / 0.6] + $300,000
= [ ($ 30,000)/0.6] + $300,000
= $50,000 + $300,000
= $350,000
In this case, the point of total assumption (PTA) or PTA Cost comes as $350,000.
Next, let’s see how PTA Price equals the Ceiling Price. After all, this is what I’ve outlined as the definition of PTA.
Cost overrun at PTA = PTA Cost – Target Cost, so:
= $350,000 – $300,000
= $50,000
The buyer’s share in this cost overrun is as follows:
= 60% × $50,000
= $30,000
The seller’s share in this cost overrun is:
= 40% * $50,000
= $20,000
Hence, the Price at PTA = Target Price + Buyer’s share, so:
= $330,000 + $30,000
= $360,000
The above value equals the ceiling price or C.P. In other words, at PTA or PTA Cost, the ceiling price has been met. You can also say you’re at ceiling cost when the ceiling price has been met.
Another thing to note is this: Cost overrun has already happened when the cost crossed over the $300,000 threshold, or the target cost, in our example. Of course, with cost overrun, the profit margin will decrease.
Now, the questions that are likely coming to mind may be:
- Is there any profit at PTA?
- Does profit become zero at PTA?
Let’s calculate the profit!
Profit at PTA = Price at PTA (or C.P.) – Cost at PTA, so:
= $360,000 – $350,000 = $10,000
This is not the initial target fee of $30,000, but a reduced fee of 10,000. So, we have some profit at PTA, although it is much reduced than the initial target profit.
Significance of PTA
Now that we know how to calculate the PTA, let’s check the significance of PTA by using the above example. With this, many misconceptions related to PTA will be dispelled.
1. At PTA, the profit is not equal to the target profit before. Rather, at PTA, the profit or margin is usually reduced.
As we saw in our example, at PTA, the margin is reduced from$30,000 to $10,000. Hence, while plotting a graph for PTA, if you see that the margin is kept the same (as before the PTA is reached), the graph is wrong. In my experience, many project managers use such wrong graphs.
The profit at PTA can be a reduced by one, zero, or negative. This is dependent on the BSR. Obviously, at a higher BSR, profit will be more, as compared to a lower BSR.
2. From the point of cost overrun till PTA, the sharing ratio will be the BSR. Beyond PTA, sharing ratio becomes 0%:100% (effectively irrelevant).
As shown in the example, from the point of cost overrun till PTA, the sharing ratio is 60:40. That is, for every $1 overrun, the buyer will pay 60 cents whereas the seller will pay 40 cents. Beyond PTA, the buyer won’t pay anything more, hence the sharing ratio becomes 0:100. For every $1 cost overrun, the seller’s profit decreases by $1, or said another way, loss increases by $1.
3. At PTA, the FPIF contract becomes a FFP contract.
The seller assumes all responsibility for further cost overrun beyond PTA. Incentives no longer apply. Hence, the contract becomes a firm fixed price (FFP) contract.
4. PTA incentivizes the contract and asks the seller to put forth a better performance.
For every one dollar overrun beyond PTA, the seller will pay (or lose) that dollar. This money will come from the seller’s margin. Therefore, PTA incentivizes the contract and asks for the seller to control cost. From the point of view of the seller, PTA can be considered to be the inflection point.
5. PTA doesn’t usually apply to a Cost Plus Incentive (CPIF) contract, rather it’s used in Fixed Price Incentive Fee (FPI/FPIF) contract.
As we have seen, the calculation of PTA requires a ceiling price (CP). The ceiling price is not set in a CPIF contract, so PTA is not usually set or calculated in CPIF contracts. Rather in CPIF contracts, a Range of Incentive Effectiveness (RIE) is usually considered.
Graphical Representation
The concept of PTA can be explained graphically. Graphical representation is very helpful because we are able to pictorially represent various incentive scenarios.
Following our example, when we plot a graph for PTA in a cost-profit curve, it looks as shown below. The graph is drawn with the help of MS Excel software.
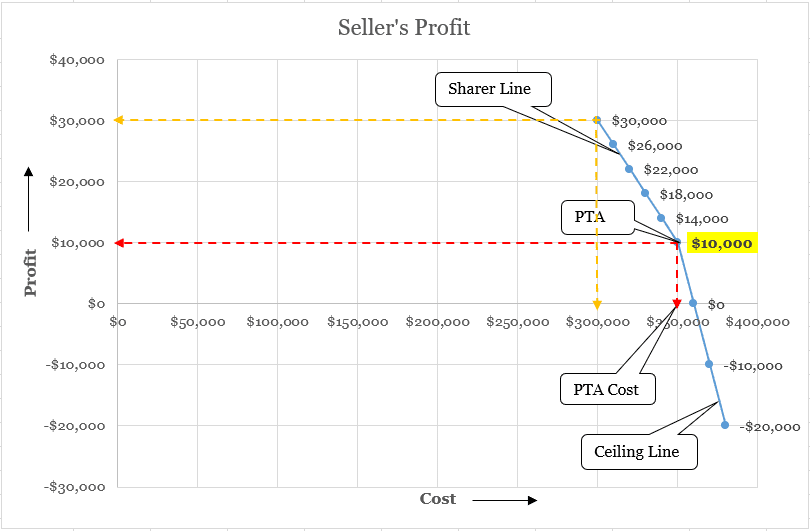
As shown, we have the cost depicted in the X-axis, whereas the profit is shown in the Y-axis. This graph has two lines: the “Sharer Line” and the “Ceiling Line.” The sharer line meets the ceiling line at PTA.
In the beginning, the target profit or margin is $30,000 with the target cost being $300,000. This is represented with the yellow dotted line. When cost overrun happens, the profit margin starts decreasing.
When we reach the PTA, we reach an inflection point and the ceiling line takes over. This line is utilized because, at PTA, the ceiling price has been reached. As you can see, there is still some profit of $10,000. The ceiling price of $360,000 is reached at the PTA cost (or ceiling cost) of $350,000. This is represented in the red dotted line.
This curve also explains how PTA incentivizes the contract. The buyer is willing to share a certain amount of cost overrun based on BSR, but beyond PTA, as the ceiling price is hit, the seller is fully responsible. As we have seen before, from this point onward the contract becomes an FFP one. If further cost overrun happens, obviously, the seller will incur losses and they will be a steeper!
Video
I’ve put together a video depicting a graphical interpretation of PTA. It is taken from my PMP Live Lessons, and uses our example showing how PTA is used in cost overrun. I also plot the data for every $10,000 cost overrun in MS Excel. My video [Duration: 5m:29s] shows how the graph is plotted and the significance of PTA along with the ceiling line and sharer line.
A Note on the PMP Exam
If you are an aspiring PMP, you may be wondering about the kind of questions you would be getting on PTA in the PMP examination. The questions are likely to come, but will be easy to solve if you have understood the concept I’ve outlined here well.
It’s always better to assume with facts than blind or total assumption. The concept of PTA nudges us in that direction—assume, but with data and facts.
References
[1] PMP Live Lessons – Guaranteed Pass or Your Money Back, by Satya Narayan Dash
[2] I Want To Be A PMP: The Plain and Simple Way To Be A PMP, 2nd edition, by Satya Narayan Dash
[3] Project Management Body of Knowledge (PMBOK) Guide, 6th Edition, by Project Management Institute (PMI)