An easy explanation of how to use this powerful problem-solving tool with a simple fishbone diagram example.
Have you ever been faced with a problem you didn’t know how to address?
It seemed that there were many contributing factors and you didn’t know where to start?
You knew what the problem was, but not how to fix it?
Or you’re working with a team and you have different ideas about how to fix the issue.
Everyone agrees there’s a problem. But nobody’s figured out how to fix it yet.
In order to solve a problem, you first have to know what’s causing it.
A root-cause analysis tool is useful for this.
And a super simple one is the Ishikawa fishbone diagram.
It was named after Kaoru Ishikawa who first wrote about it in the 1960s. And it’s called a Fishbone Diagram because it looks a bit like a fishbone.
This tool can be created electronically, but it can also easily be done on a whiteboard or a piece of paper. You don’t need anything fancy or technical to use this tool.
And it can help you uncover possible causes to problems you may not have considered.
It’s a great group activity because it not only allows a group to brainstorm root-causes. It also helps the participants get a better understanding of all the possible factors that could be contributing to a problem.
[click_to_tweet tweet=”The fishbone diagram is a great problem-solving tool. It’s simple to do and you don’t need any fancy technology. It stimulates ideas and helps teams understand the root-causes to problems. #projectmanagement” quote=”The fishbone diagram is a great problem-solving tool. It’s simple to do and you don’t need any fancy technology. It stimulates ideas and helps teams understand the root-causes to problems. #projectmanagement”]
Why the Ishikawa Fishbone Diagram is a great Root-Cause Analysis tool:
- It helps you think of things you may not have considered. Different categories stimulate ideas in a brainstorming exercise.
- It helps you communicate with team members. It gives structure around the cause-effect exercise. It’s easy for participants to grasp how to use the tool, and work through different categories of possible causes to your problem.
- It’sasy to use. You don’t need any fancy software to use this tool. You can do it in Word or PowerPoint, or Excel. Even better, you can do it on a whiteboard or a piece of paper.
When to Use it
Use this tool any time you’re problem-solving or trying to determine the root cause of an issue or problem. It helps you see beyond the surface and dig deeper to get to the real issue.
![]()
How to Use the Ishikawa Fishbone Diagram
Depending on your organization or needs, you can use different categories for your fishbone diagram. Here are the simple steps to take when doing this exercise with your team.
1. Explain to the team what you’re going to do. Let them know that the diagram will help you see different categories or potential areas that may contribute to your problem.
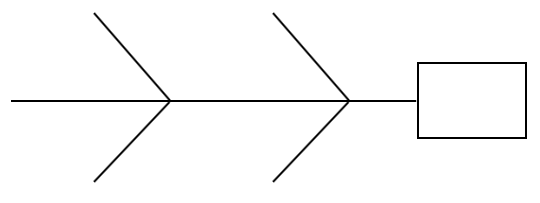
2. Draw your diagram. Draw the template or shape on your whiteboard, or draw it in your tool of choice. If you need to do this exercise with remote attendees, you can easily create it in PowerPoint and share your screen. I personally prefer doing this on a whiteboard.
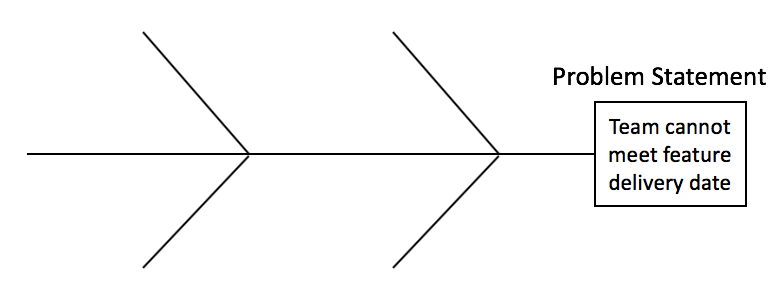
3. Determine a clear problem statement. Write this at the top of your page or above where you’ll create your picture. This ensures everyone has the same understanding of what problem you’re addressing.
In our example, we’ll identify the reoccurring problem that the team cannot meet the feature commitment.
4. Choose the Categories you’ll use. Categories are explained more in-depth below. For our example, we’ll add use the categories of Policies, Procedures, People, Technology
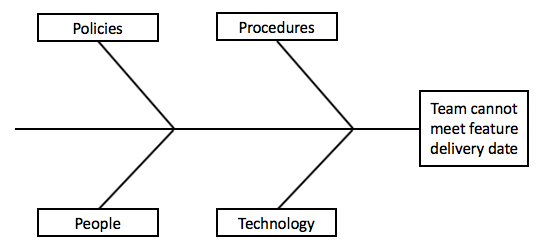
5. Identify possible causes to your problem within each category. Team members will brainstorm causes or contributing factors that fit into each category. You can either go category by category or simply come up with ideas and decide which category they fit into.

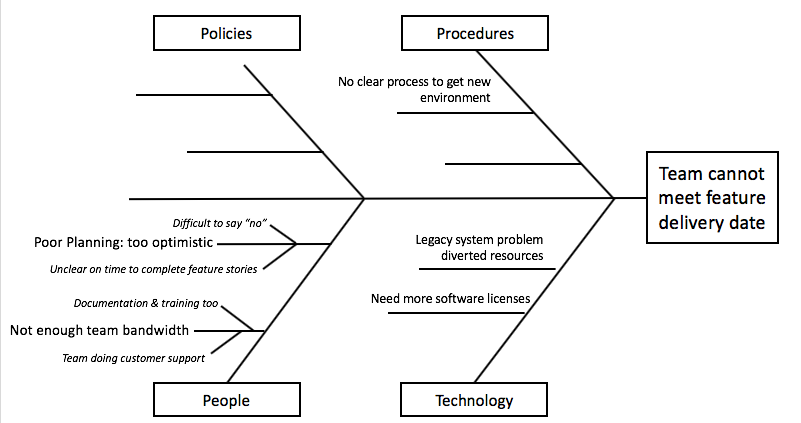
6. Go a step deeper to identify sub-causes for each category cause. If you determine that you can or need to break something down to smaller points, create branches from the main point. It could look like this image:
7. Team members review the diagram to determine most important areas of focus. If you’re going to take this a step further to address the root cause, it helps to identify where you’ll get the most value for your effort. You can’t address all root causes at once, and some will have better payoff than others. Review the diagram to assess where your team’s focus is best placed.
8. Vote on which root-causes to address first. Team members place their votes on where the best places to focus efforts are.
9. Agree on the top areas you’ll place your focus. Now that you’ve all voted, agree on the priority order you’ll address these items. This may be one, two, or three top prioritized areas.
10. Document your findings. You’ve put in the effort. Capture your work and document it. You may need to refer to it later and you don’t want to lose the value you’ve gotten from the exercise. You could simply take a picture of the whiteboard and recreate it in a PowerPoint you’ll share with management.
Possible Fishbone Diagram Category Choices
The categories listed below are common choices for the diagram. Determine which is the right fit for your needs.
4 Ps
- Policies
- Procedures
- People
- Plant/Technology
The Ms
- Machines
- Methods (Process)
- Materials
- Measurements (Inspection)
- Mother Nature (Environment)
- Manpower (People)
- Management (Policies)
- Maintenance
- Marketing
Process Steps
- Site
- Task
- People
- Equipment
- Control
Summary
The Ishikawa Fishbone Diagram is a crazy simple tool. It stimulates ideas and conversation and can be used with no complex technology. If you have never used this tool, I strongly suggest you give it a try in your next problem-solving session.
And check out this post on how to run a successful brainstorming session to get great ideas from your team while problem-solving.

No Responses