
If you are looking to answer questions such as how your team is performing or your company for that matter and want to do so quickly and accurately you need to be asking yourself another question first.
That is what is a KPI report?
And while KPI reporting is fairly common, let’s go back to the basics and remember what is a KPI report and understand how to create a KPI report so that your business can use the data to improve and reach its goals.
What are KPIs?

Before we can move on to properly understanding what is a KPI report, it is important to first know what a KPI actually is.
A KPI, or Key Performance Indicator to use its full name, is a standard assessment that illustrates just how effective your sales force is at accomplishing key business goals.
KPIs also provide helpful insights to assist salespeople to enhance their productivity by monitoring their performance on a regular basis.
While your objective may be wide, your KPI will always be a specific, precise, measurable number.
This cannot be any random number. The “key” portion of the “key performance indicator” means that the number has to be a significant representation of performance.
Therefore, it can be seen that there are two main components to the definition of a key performance indicator:
- A key performance indicator must be easily measurable and thus be quantifiable.
- A key performance indicator must be measuring a key goal to be classified as a key performance indicator.
What is a KPI Report?
Now let’s move on to understanding what is a KPI report. A Key Performance Indicator report is a report that enables business executives to simply and quickly analyze and evaluate KPIs or Key Performance Indicators which allows them to see how their company is performing in relation to certain strategic goals.
KPI reports nowadays employ interactive data visualization with any underlying data easily accessible through a single click to offer executives the option to further investigate.
This allows all individuals, even those who are non-technical users, to be able to observe patterns, detect correlations, and find outliers in their data using the report.
This in turn allows for revelations that lead to actions and ultimately improve company outcomes.
Therefore, when you consider what is a KPI report you can think of a report that aids organizations and companies to be able to extract more value from their data, develop data literacy, and foster a data-driven decision-making culture.
Featured Readings:
What Should be Included in Your KPI Report?

While each KPI report will be different there are certain elements that are universal across different KPI reports no matter the industry they are related to or the team they are created by.
Here are some basic elements that most Key Performance Indicator reports have:
1. The Objectives
Most KPI reports share the high-level company goal or the reason the KPI is being tracked in the first place and what goal it is trying to achieve.
The objective highlights what your company is trying to improve in terms of the organization’s strategy.
This section of the report should be straightforward and not include unnecessary and excessive details but rather be brief and to the point.
2. Measure Source and Relevant Formula
The measured source is the KPI itself and where the data for tracking that KPI is coming from. This could include things such as a CRM system if you are tracking website visits for example.
Depending on what the KPI is that you are tracking you may need to apply a formula to get the relevant data. This formula or calculation should also be mentioned clearly in the KPI report.
3. KPI Owner
Every KPI is usually assigned an owner. This is the individual who is responsible for tracking the KPI.
By assigning a KPI owner and indicating this on the KPI report you ensure accountability.
4. The intent of Measuring the KPI
Any good KPI report includes describing why you are tracking your KPI and what tracking this data is aimed at achieving.
This section can be put into a fair bit of detail to ensure that the KPI owner and team know exactly why it is that this report is being created and the KPI is being tracked.
5. Measure Data
The measured data is the actual data that is being used to track the relevant KPI.
6. Graphical Representation
To ensure you have an effective KPI report you want to consider how you will display the data to those who will be receiving the report.
Depending on what the actual data is that you collect you need to consider what is the most valuable to the people this data will show.
You should aim not to overcomplicate anything and choose a standard graph or chart that is consistently used so as to allow individuals to compare KPIs over a time period.
Choosing a graphical representation ensures a clear and easy-to-understand display of the data in the report.
7. Analysis
Finally, you have an analysis of the data. This is where you will describe why the status of your KPI is as it is.
You want to provide qualitative reasoning and context behind the current status and progress.
These are some of the different common elements that you will find in all kinds of KPI reports. Let’s see what different kinds of KPI reports there are anyway.
Different Types of KPI Reports

There are different types of KPI reports that are used by companies and organizations. To be able to answer the question of what is a KPI report you need to understand the various types of KPI reports that companies and organizations use.
There are four main types of KPI reports. The four types of KPI reports are:
- Analytical KPI Reports
- Strategic KPI Reports
- Operational KPI Reports
- Executive KPI Reports
Let’s look over each kind of KPI report in turn.
1. Analytical KPI Reports
Analytical KPI reports are those reports that go into further depth on the key performance indicators.
These reports can be used in relation to any aspect of the business. They are intended to provide answers to issues raised by ups and downs in the KPI data.
A static version of this report generally displays historical numbers, but interactive reports let the users dig deeper into the data by dynamically breaking down specific metrics.
2. Strategic KPI Reports
Strategic KPI reports are another common type of KPI reporting that is intended to offer a relevant and clear picture of a company or organization’s health as well as the direction the business is going in.
Such reports indicate how the organization is functioning in relation to its aims and goals to those who it affects such as owners and stakeholders.
3. Operational KPI Reports
The third type of KPI report is operational KPI reports. These are those reports that are primarily concerned with a company’s day-to-day operations.
These reports give data to those individuals that participate in such activities in order to assist them in making necessary choices or taking necessary actions.
4. Executive KPI Reports
Finally, you have executive KPI reports. These reports deal with the long-term strategy of a company or organization.
The report examines critical success factors for the long-term strategy.
This type of report often includes things such as time-based trends, high-level key performance indicators, and predictions.
How to Create a KPI Report?
Creating a KPI report can often be confusing and daunting for first-timers. Here is a basic guide to some simple steps that you can use in order to start creating your next KPI report.
1. Start by Creating an Outline
Great practice for starting any kind of report is creating an outline or overview and it is no different for KPI reports.
Determine what the criteria of the report are so that you have a basis for when you start creating it.
Try and answer questions such as what the objective of creating the report is, who the audience of the report will be, and how the report will be used.
2. Define What the Key Performance Indicators are
Once you have created your overview it is time to go into more detail and define what your Key Performance Indicators are.
The objective of the KPI report will help you determine both your KPIs and metrics. Remember to select a KPI that is measurable and key to your company’s performance as discussed in the definition above.
You will also have to figure out whether the data to measure your KPI is readily available. You may have to come up with ways to gather that data or see if it can be automated.
3. Presenting Your Data
You have done the planning now it is time to choose how you wish to present the data to your relevant audience.
This is where you will consider the graphical representations we discussed above. Choose a graph or chart that will easily present the information in a simple way so as not to cause confusion.
4. Finalize the KPI Report and Distribute it to the Relevant Audience
To ensure your report is efficient you may need to adjust and evolve it to make it be effective in putting forth the KPI data and analysis so that your team can take actions to better your organization’s processes to meet objectives.
A KPI report is not a one-off event and to ensure your data delivery stays efficient keep going back to the report and ensure that you review it and make adjustments as needed.
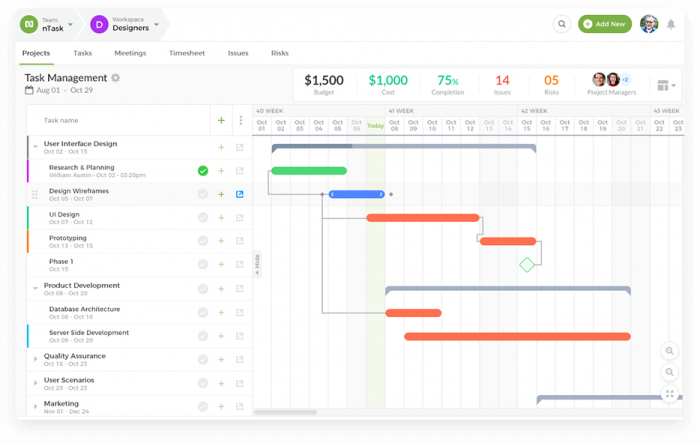
To distribute your KPI report nTask offers simple and easy-to-use communication tools, file sharing, and file storage.
You can share the KPI report and discuss the report all within the platform and save the KPI report in the platform to be referred to later on.
Moreover, nTask’s comprehensive meeting management module allows you to create meeting agendas and take minutes of the meeting for any team meeting that needs to take place in order to discuss the KPI report.
In Conclusion
A majority of the businesses out there report on key performance indicators. The challenge is to use these key performance indicators to provide your company with the data it needs to deliver and work at its most efficiently.
While you may think you or your organization knows the answer to what is a KPI report, sometimes taking a step back and going back to the basics can help reiterate how to create KPI reports that are the most beneficial for your team.
More articles for you:


