Report Update: Non-Grouped Results & Multiple Levels of Report Results
Another new and accompanying update to the recently released Hub Planner Reports is a really useful feature to non-group report results. Simultaneously, now stay within the same report to view multiple levels of report results.
What’s the new report update?
On the back of the recent rebuilding of Hub Planner Reports. We have and will always update and refresh features as part of our great relationship and rapport with Hub Planner users. Now, we release two updates to Reports. Firstly, you have the ability to drill down through reports for a breakdown of raw report results. What was previously two levels of report results, now accelerate analytics with navigating through up to four levels of report results. Not only that, we’ve provided the option of ‘non-grouped results’. What does this mean? This means that the user can remove any levels for a thorough breakdown of raw results data reporting.
For example, I want to see a day by day breakdown of who worked on what. You might say I can do that already? Correct, but previous to the new reports update, the user would have to navigate between levels to obtain the breakdown. Now, these levels are eliminated and you get the breakdown all in one screen. Otherwise known as ‘non-grouped results’!
How it Works?
Let have a look at what each level of report results will represent.
- Is what the report is grouped by, resource for example
- Click a resource then you see all the projects and corrosponding data for that resource
- Group the same data by day, to your date range
- Raw report result line items for that day

What does Grouping Report Results mean?
What grouping means, is that you can group the results from the report you created by an alternative group option. Using the Resource Report for Scheduled Time, we can opt to group by Booking Categories for example. So now the Resource Report Scheduled Time will now produce the report categorized or grouped by associated Booking Categories. Removing the grouping function allows sight for a full spectrum of results.
How to apply Non-Group Result Report (Template)
From the report template you have created a report from:
- Navigate to the Report Toolbar.
- Click ‘Edit’
- Select ‘Grouping’
- Click ‘Do Not Group Results’
- Click ‘Update Report’
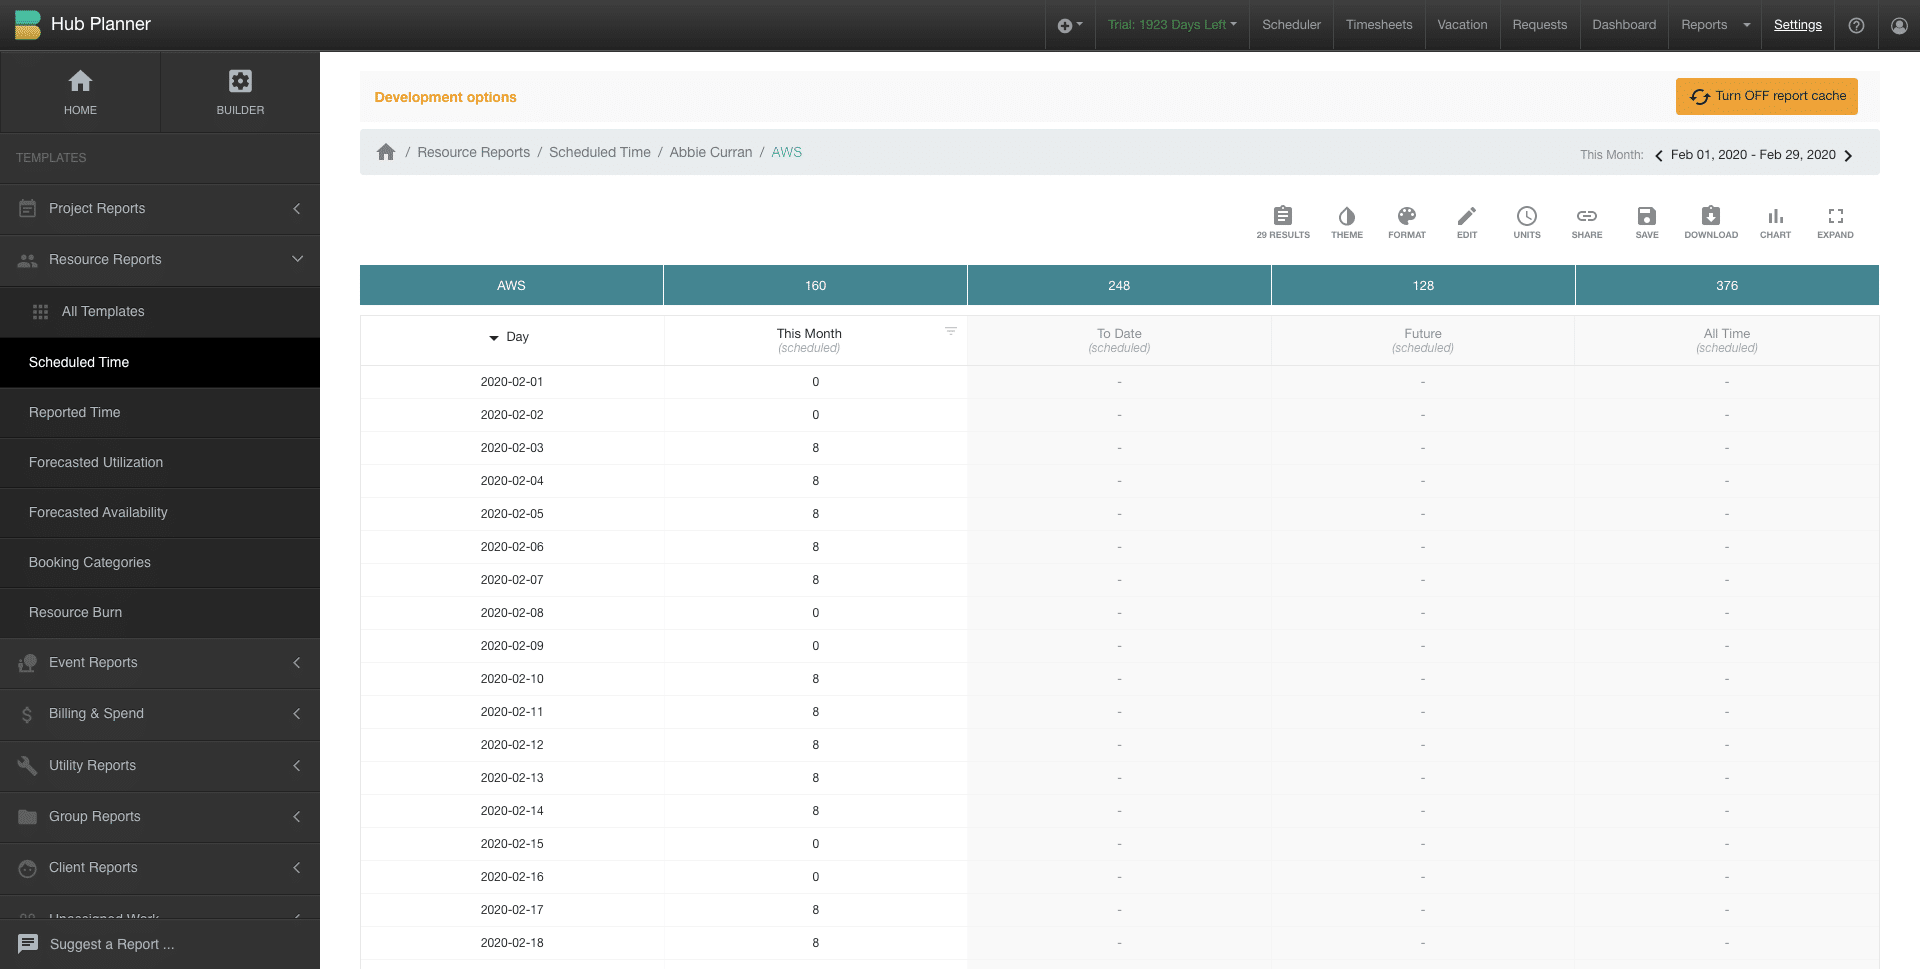
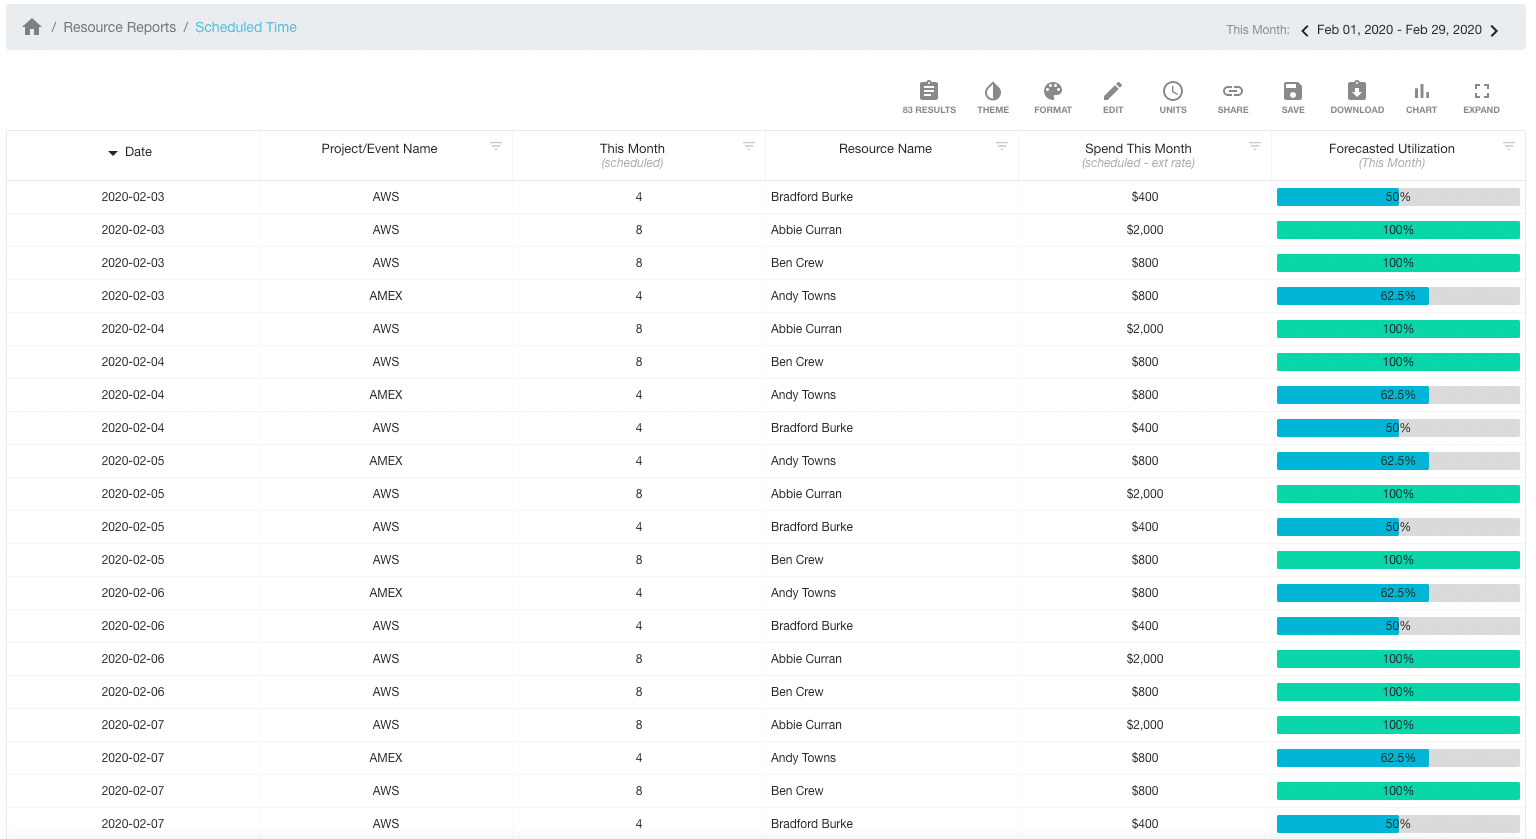
Here we have a day to day breakdown of raw line item result data. Click on the images below for a closer look.

How to apply Non-Group Result Report (Builder)
Instead of non-grouping results via one of Hub Planner’s 70+ templates. Why not create via the report builder? Here, when ready to build your report. You can simply choose “Do not group results”. Which basically shows you the raw result level line items. Alternatively having created a report, you can navigate to the Report Builder and switch the grouping off.
Get to know how to use the full spectrum of the Report Builder via the Knowledge Base.
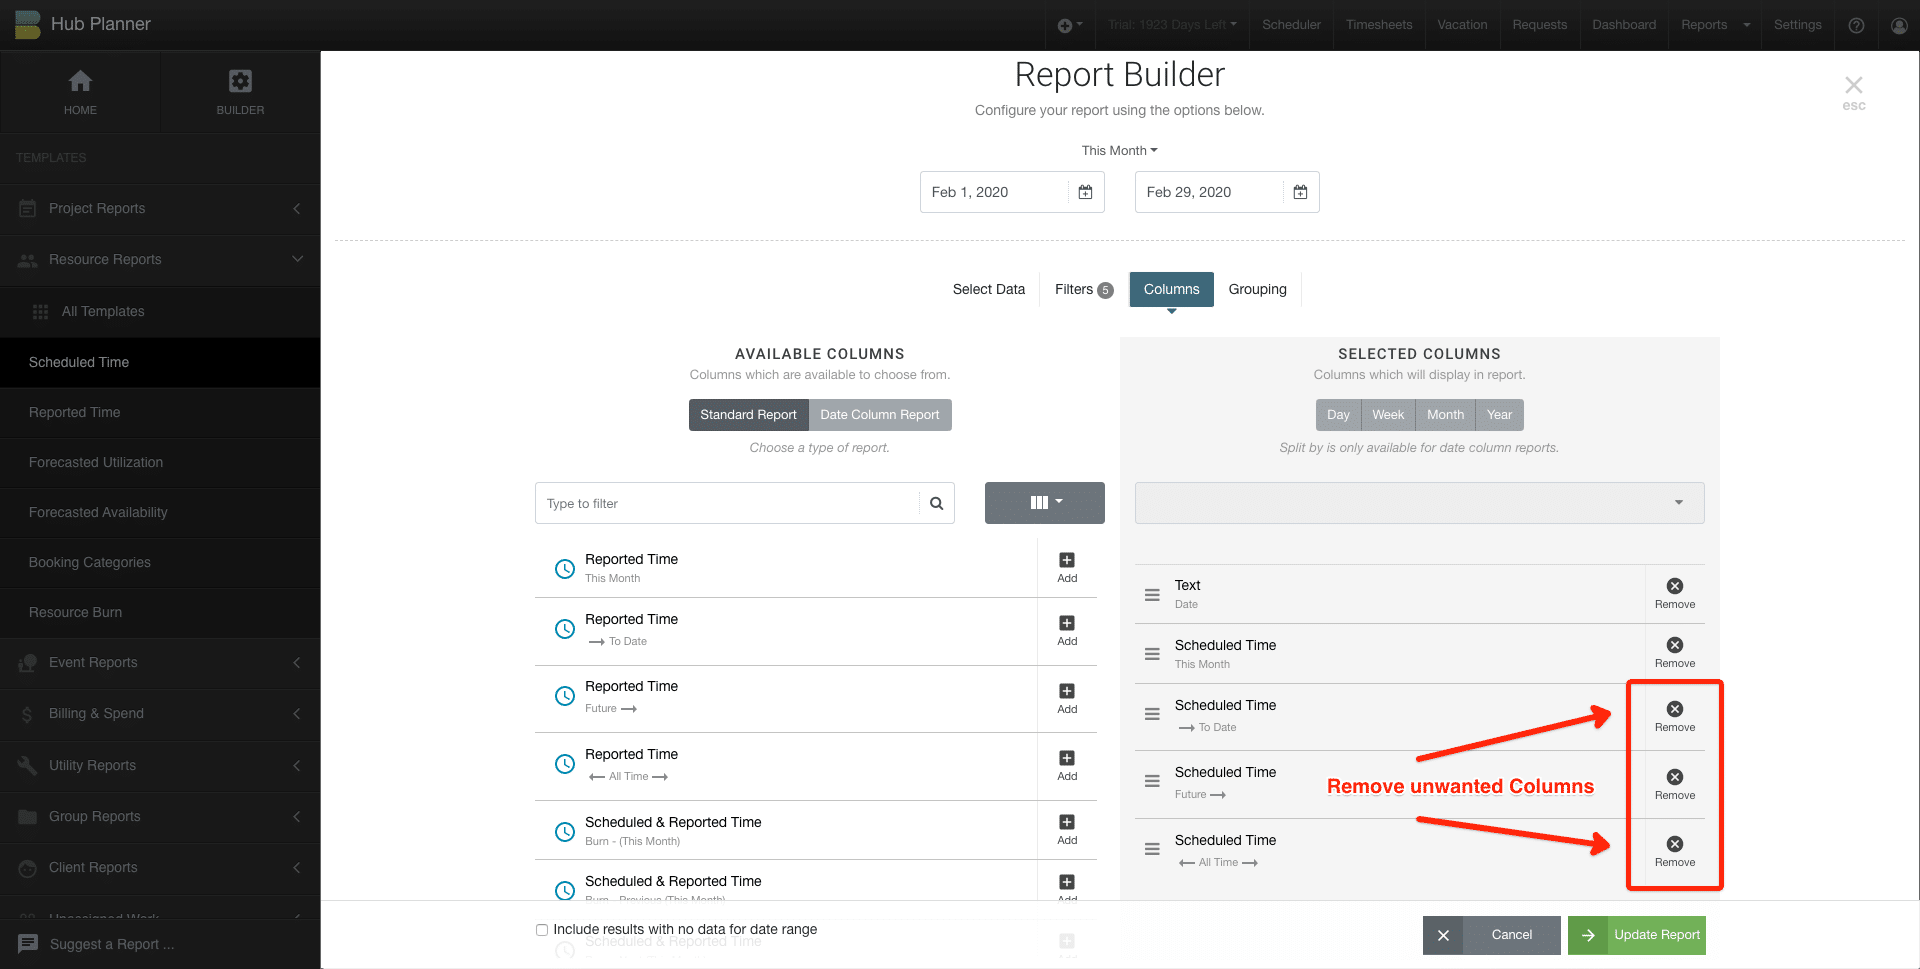
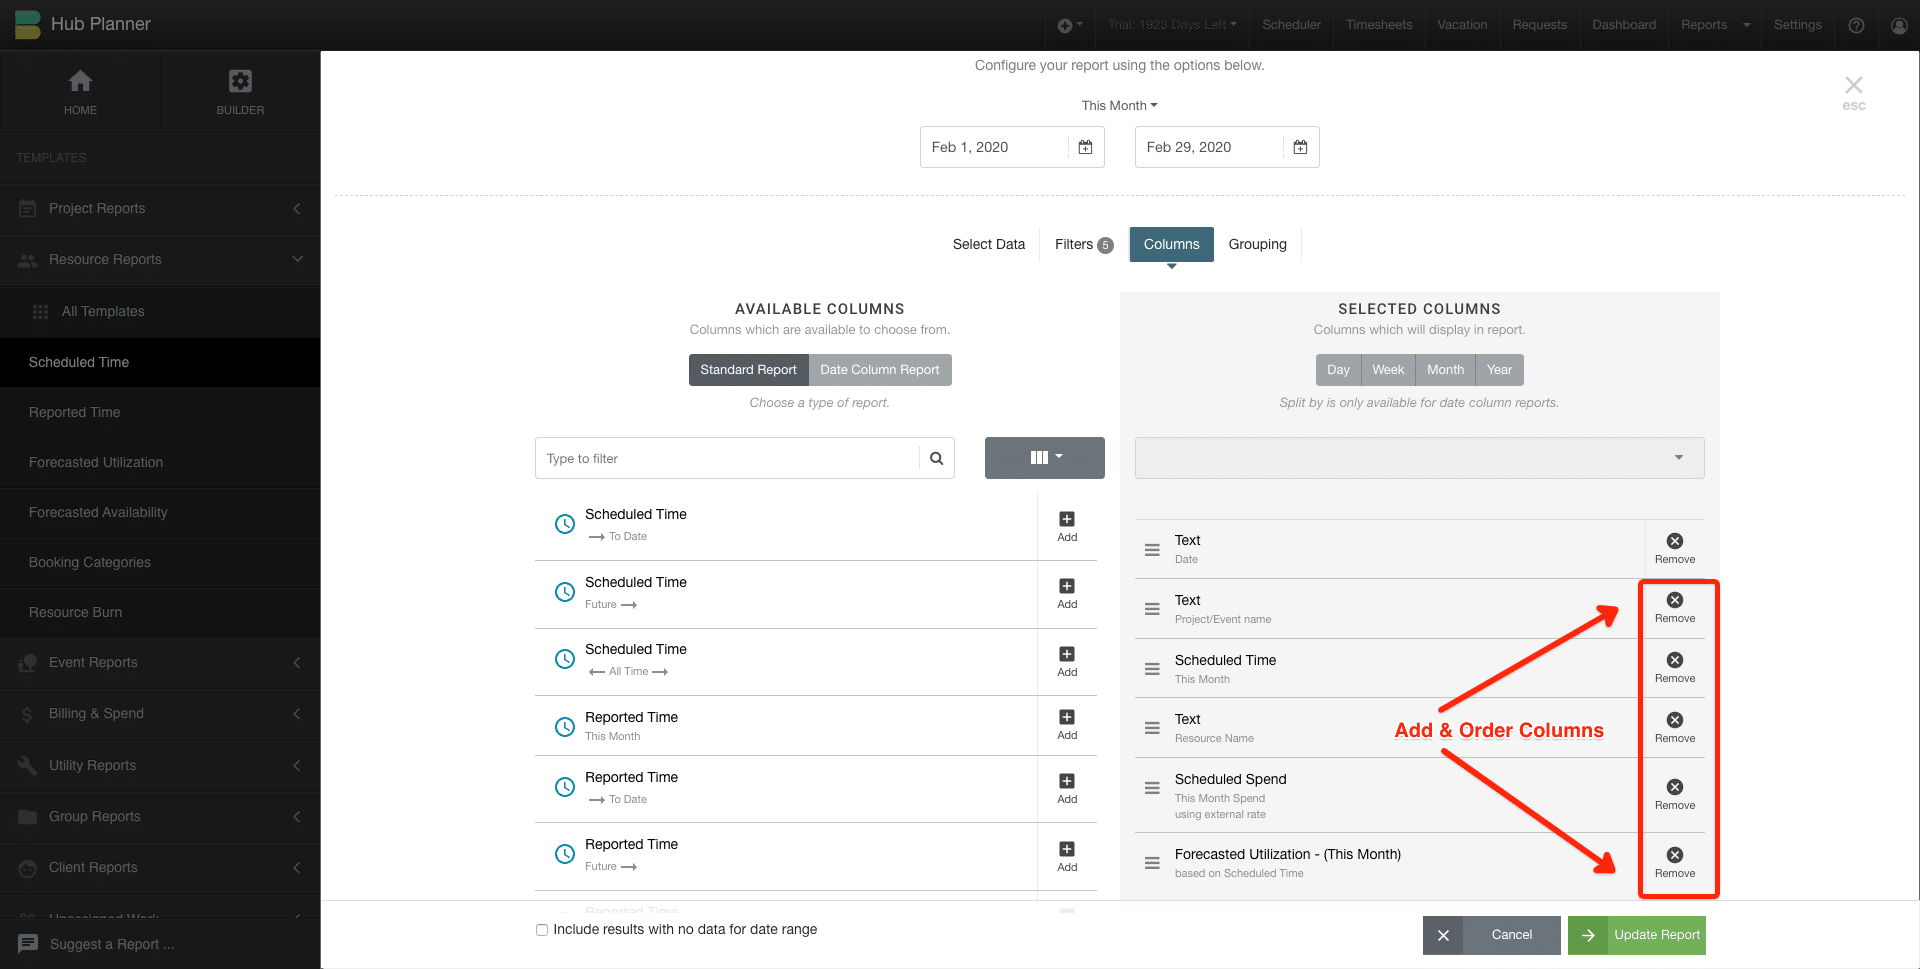
Adding & Removing Non-Grouped Columns
Continuing from non-grouping of reports. We can also add further columns data to the report. For example, I want to add in the Resource Name, Project Name, Reported Time & Utilization Rate. To do so:
- Navigate to the Report Toolbar.
- Click ‘Edit’
- Select ‘Columns’
- Remove the columns I don’t want to report on
- Add Columns (Resource Name, Project Name, Reported Time & Utilization Rate)
- Drag and Drop column order to your preference
- Click ‘Update Report’
Now I have full sight of raw report data with added columns to compliment the raw data. To find out more about the functions of how to edit, format and save, etc. Do check out the dedicated Report Toolbar Knowledge Base
How can I see a timeline or track what has been reported?
As you navigate through the levels, keep an eye on the address bar where it will show you a breakdown of each level. Navigate backwards by clicking on the breadcrumbs.
![]()
Sort, Filter & Format
Opt to sort columns to your preference.
Full formatting and filtering options are availbale to you on each level of reports. By use of the report toolbar. Apply filters as required. Create and implement multiple conditional formatting rules to the report to highlight key data. You can also sort your report by selecting a column to sort.
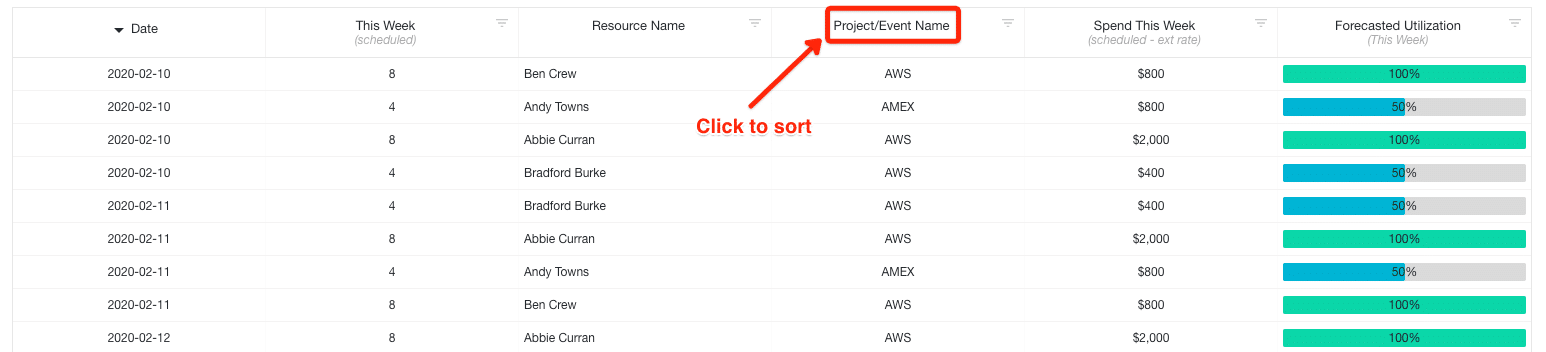
How to Sort Non-Grouped Results Reports
Select the column title header you wish to sort. By clicking, this will sort the report A-Z by the selected column. It will be identifiable by a bold arrow to indicate the column is sorted.
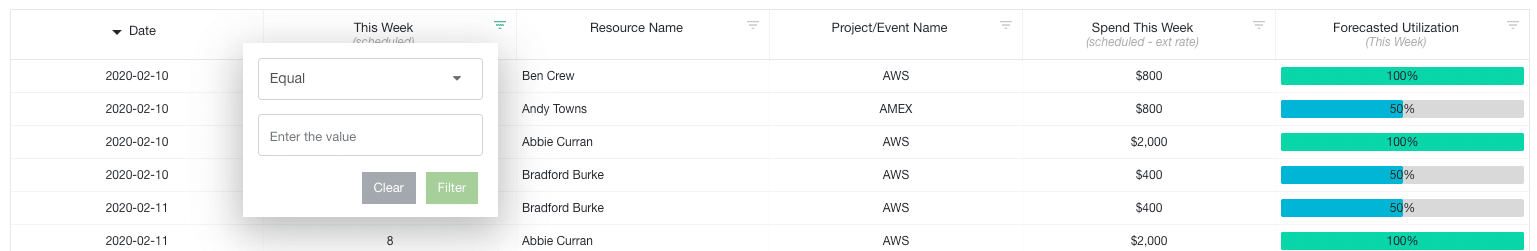
How to Filter Non-Grouped Results Reports
There are a couple of ways to filter your report results. You can iniate filters from the report toolbar -> edit -> filter. Proceed through the filter options. For more in-depth help, check out the Knowledge Base of how to use Report Filters.
You can also filter driect from the column. Select the column you wish to format. From here, click the arrow located within the top right hand side of the column header. Choose the options and click Filter. To clear filters, simply click on the arrow and select ‘Clear’.
- Starts With
- Ends With
- Contains
- Equal
- Not Equal
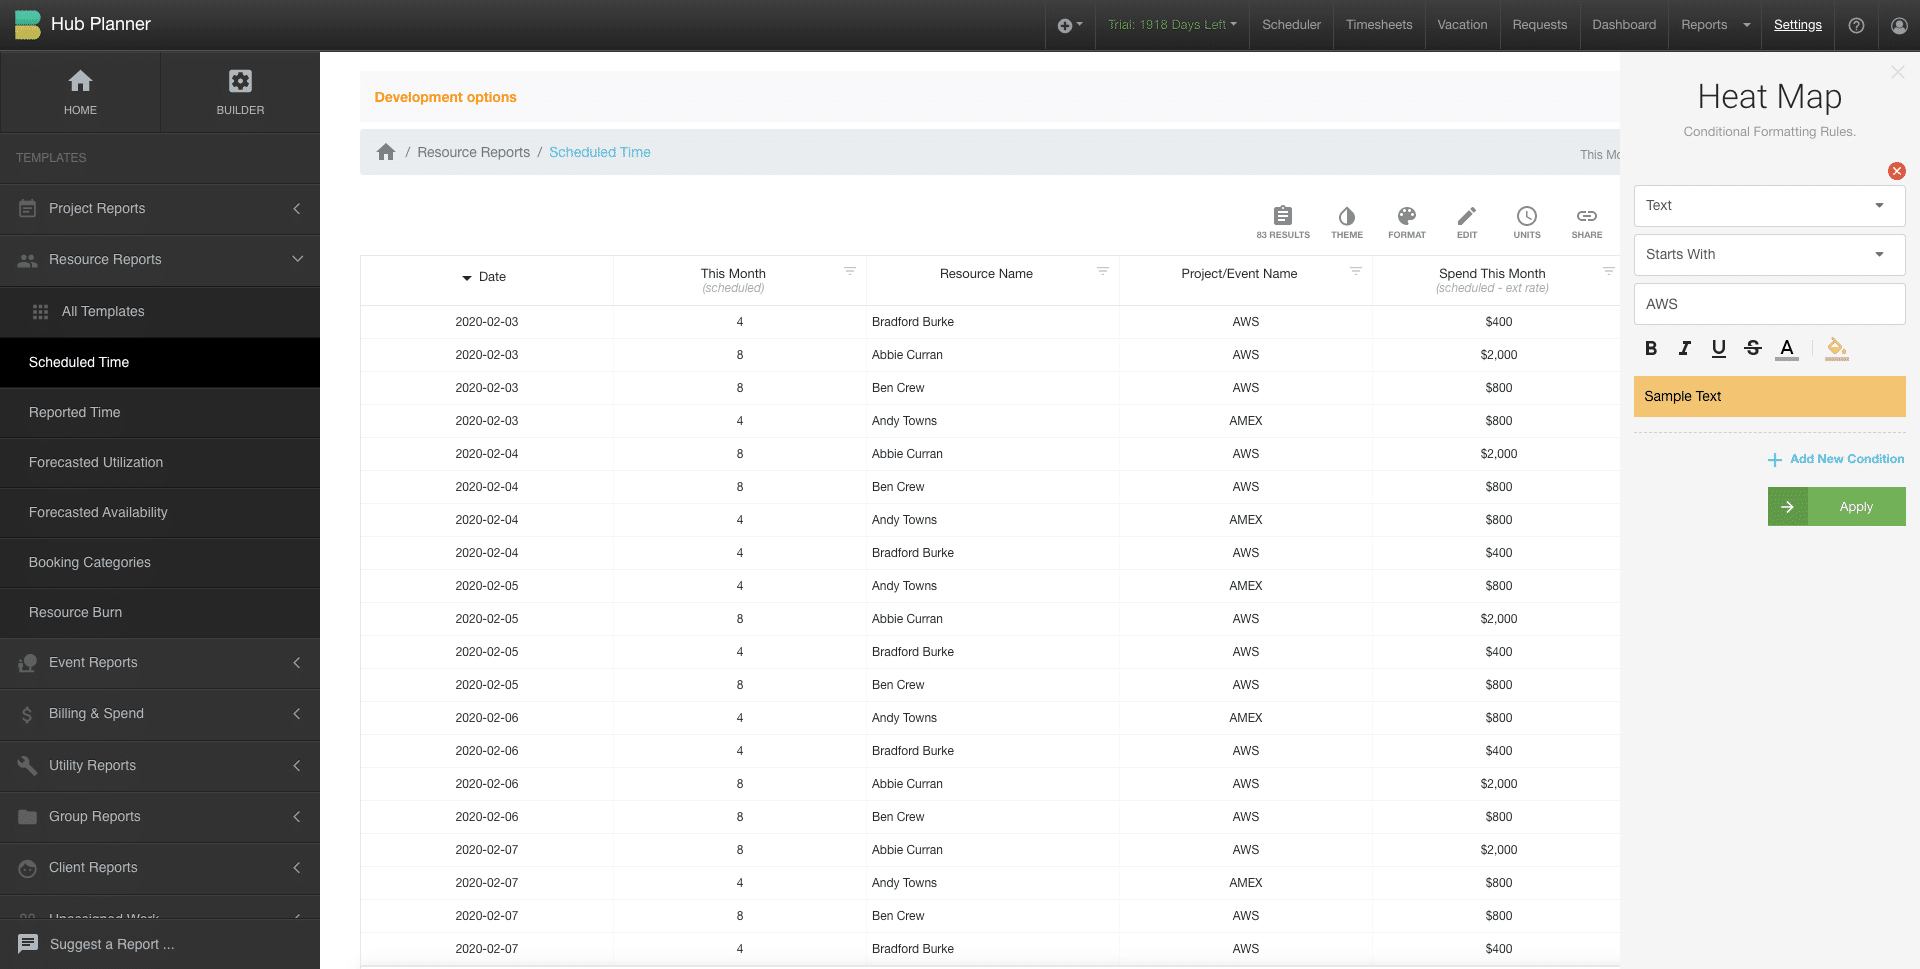
How to format Non-Grouped Results Reports
There are a couple of ways to do so. Take a look at the Conditional Formatting Knowledge Base and press release on how to activate. Formatting a report can be used to highlight key data to which you can apply multiple rules. Click Format within the Report Toolbar to access the formatting pop up. Apply one or multiple rules to your preference. It might be worthwhile saving the report for future access that saves you from having to repeat.
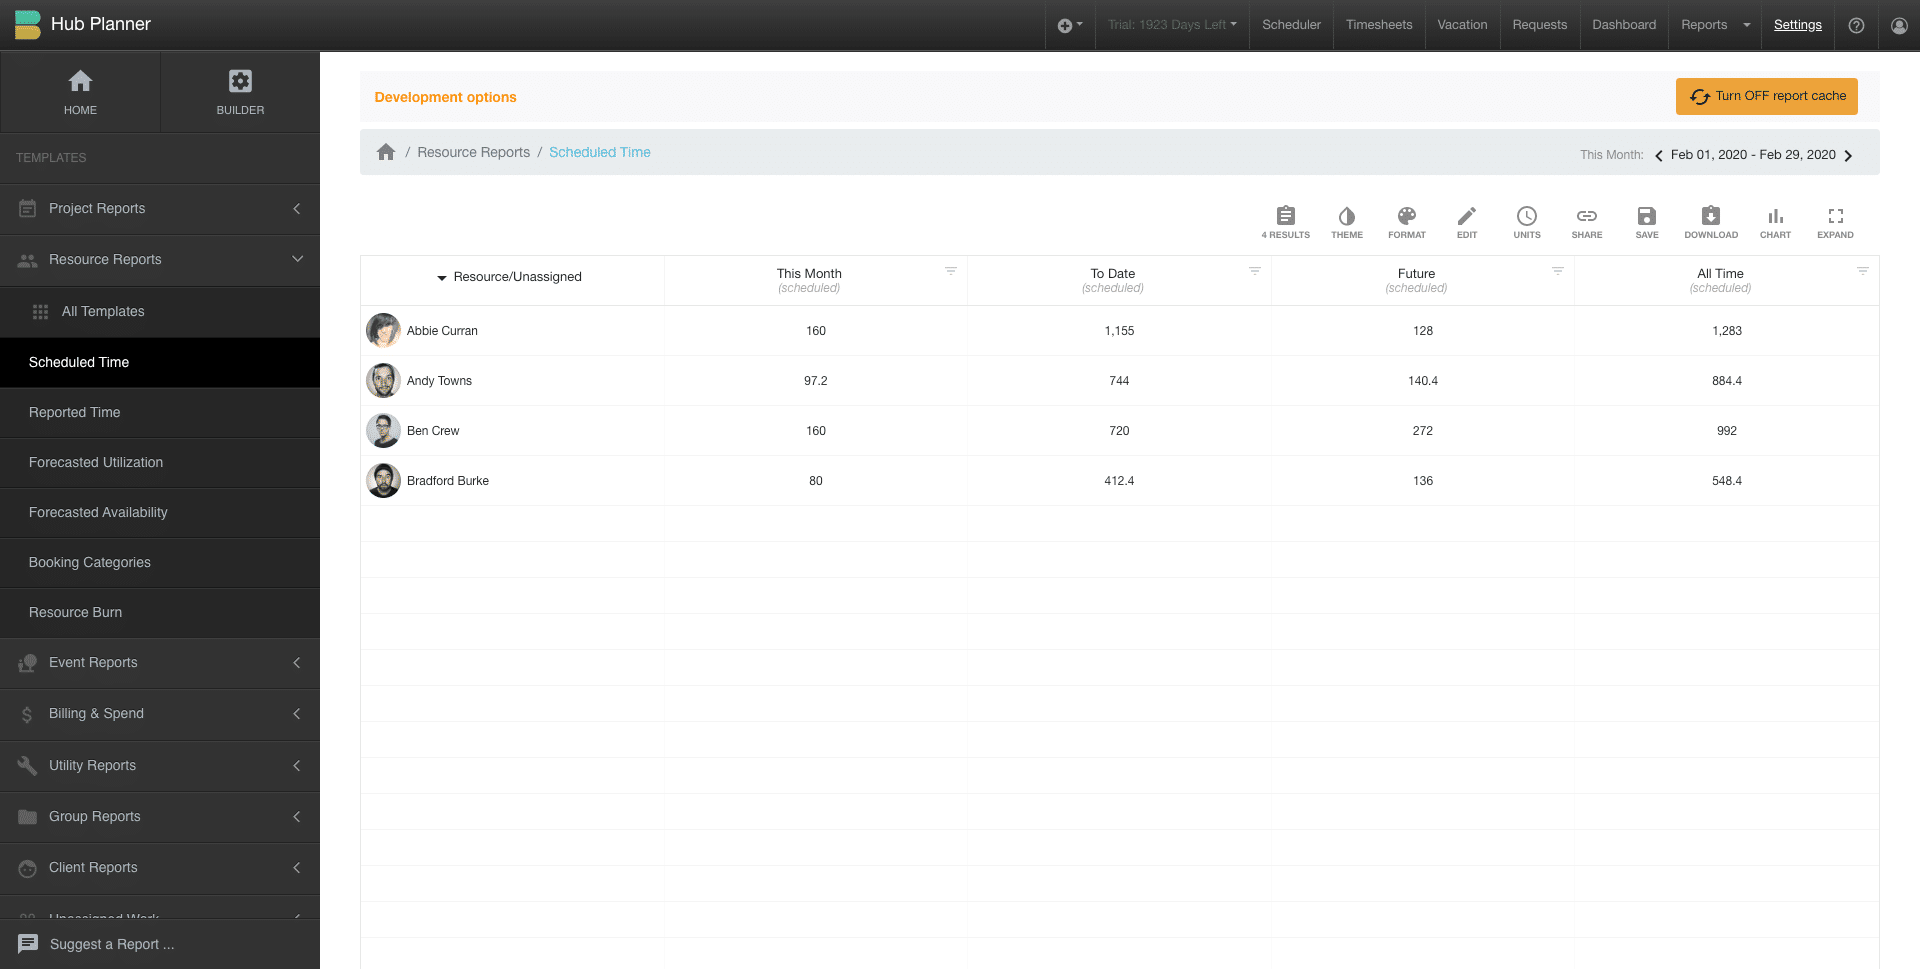
Layout of the Non Grouped Results Report
In line with the release of The Best Resource & Project Reporting Templates Hub Planner allows you to group reports by varying options. For example, you might have created a Resource Report for Scheduled Time. You also have multiple options to filtering the results, adding or removing results to grouping of the results.
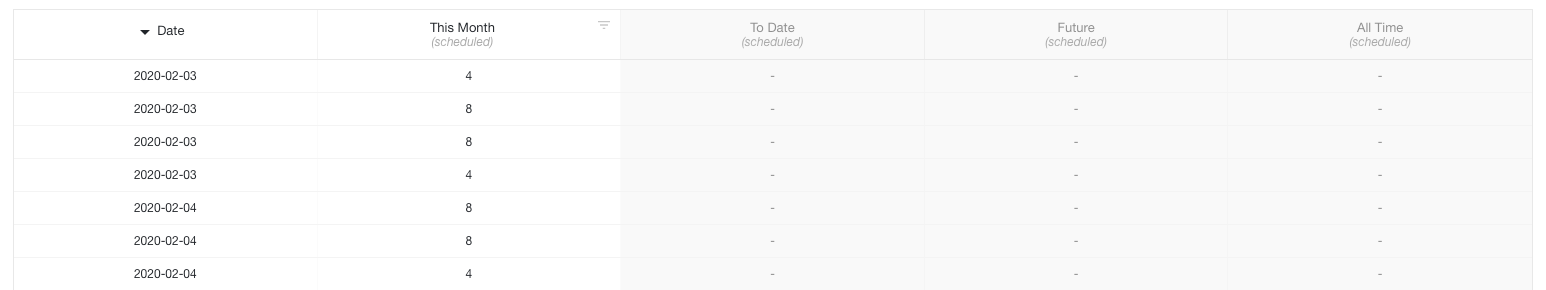
Initally if you activate non-grouped results at level 1, you will obtain the raw results broken down. You will notice that some of the original results columns are greyed out. This means that they are non functional. As in, they don’t make sense to non-grouped within this results report. Using the report example Resource Scheduled Time for the month, let’s look at the inital columns you report:

If you were to non-group results in this report. It will ungroup column ‘This Month’. Therefore, the remaining columns To Date, Future and All Time would not make sense. Reason being, as they would not be involved in the beakdown of This Month’s results. So what happens is, the 3 remaining columns results will be greyed out.
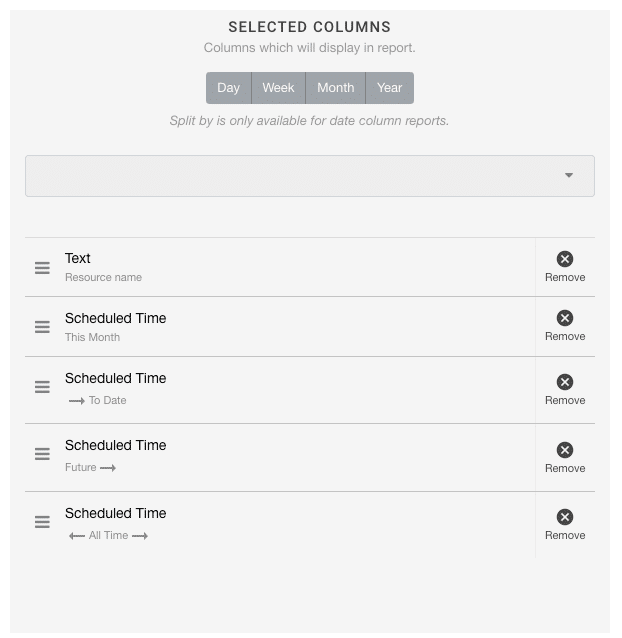
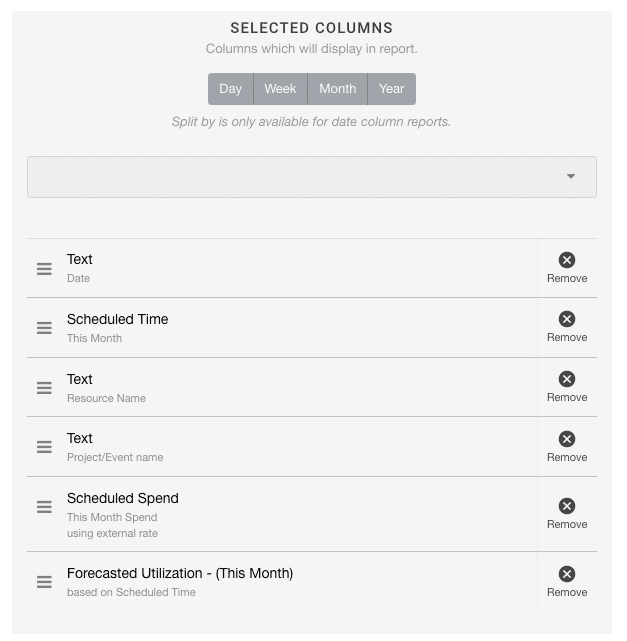
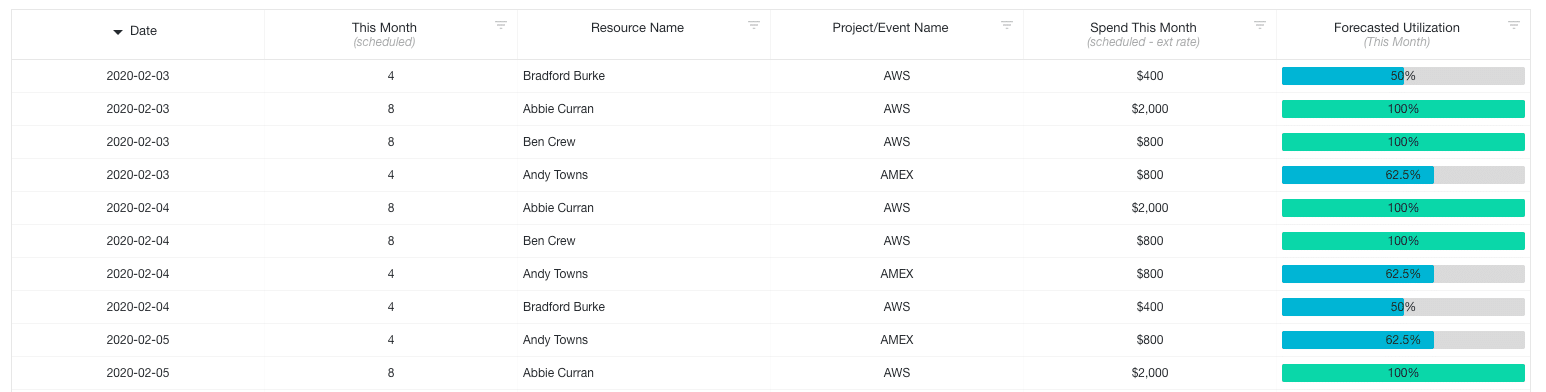
From here, you can add in columns that are functional to the resutls of this report. For example, I want to add in which resource name is assocaited with the results. I also want to see the corrosponding project name. Maybe the utilization and spend for example. By adding this in, I will now have a full view of the results report.
Remove Selected Columns
Add Selected Columns
New Column Categories
Further Reading
- Hub Planner Reports for Resource Management Find out all about the Best Resource & Project Reporting Templates and how they simplify Resource Management.
- Knowledge Base – For more help on how to use multi level report and non-grouped report results.
- Reports Help – Overall helpdesk for everything Reports.