Schedule a demo of LiquidPlanner with a product expert today


When you use a data-driven project management platform like LiquidPlanner, you generate a lot of important information that needs to be organized, accessed and acted upon. So how do you corral key data as quickly and easily as possible?
We have a nifty three-pack of feature improvements that makes it easier to manage project data than ever before.
These updates are:
- Additional Custom Fields
- Dashboard Archiving
- A new Analytics Totals row
Here’s a look at each update.
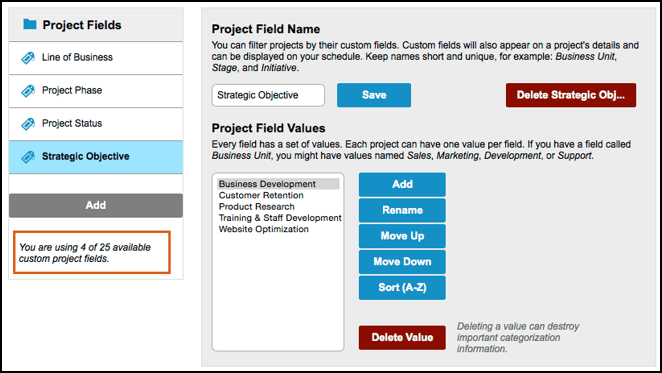
More Custom Fields
Enterprise edition workspaces now have more custom fields to work with–25 project fields and 25 tasks fields to be exact! (Up from 10.) For teams that run a lot of complex projects, custom fields help keep project data organized and properly categorized–great for capturing attributes that you can filter against.
For example, a business can use custom fields as a way to stripe work categories, process flows or geography–the choice is yours. Read more about custom fields here.
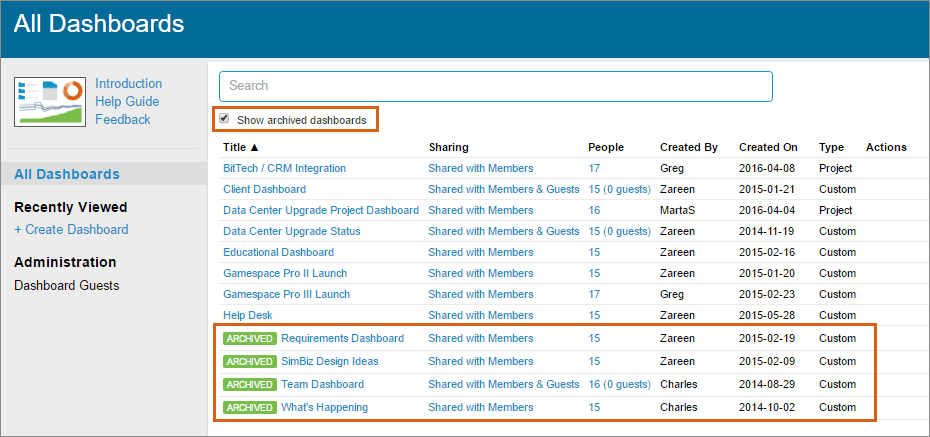
Dashboard Archives
Our customers love their dashboards as a way to visualize data and share project information. But what do you do when the project ends? The new archiving feature lets you archive individual dashboards after they’re no longer needed. By archiving, instead of deleting dashboards, you can retrieve them through search whenever you want. Archives keep your workspace lean and mean. Plus, you can create more dashboards without worrying about your list growing out of control. Note: Dashboards can be archived by editors and creators.
Dashboards are available with the LiquidPlanner Professional and Enterprise editions only. To see how dashboards are used, check out the Dashboard Gallery.
Analytics Summation
Need to know how many hours were logged towards all of your client projects last quarter? Now, when you run an Analytics report, you’ll see a Totals row at the bottom of the data table that automatically calculates data for each column.
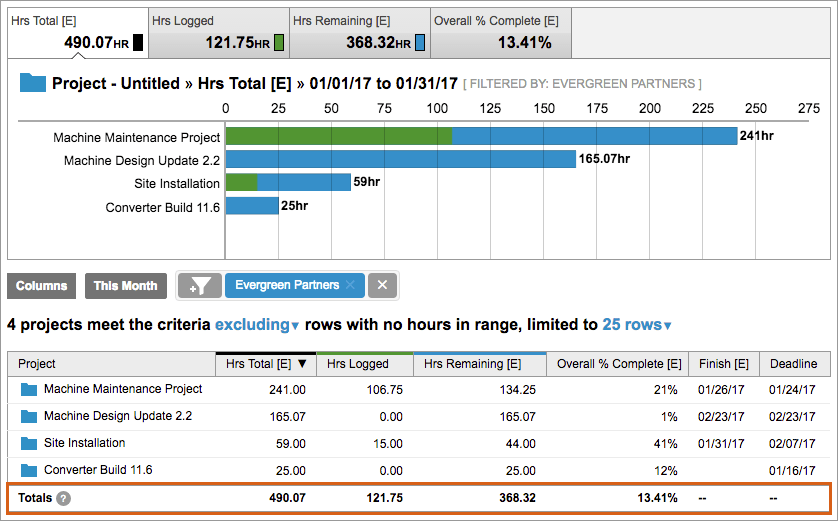
This saves the step of exporting reports into a spreadsheet or doing the math yourself. To sum things up–LiquidPlanner does the calculating for you!
Advanced Analytics reports are available with the LiquidPlanner Professional and Enterprise editions only. You can learn more about our Analytics feature here. For a full rundown, read the release notes.
We hope these upgrades get your year off to a great start!
If you’re not a LiquidPlanner customer and like what you see here, give us a try!