
Gantt charts are very popular with project managers and senior managers. They are primarily used to create and communicate project schedules but they can also be used for preparing status reports and giving presentations. They can be combined with project milestones to create richer status reports and presentations.
Gantt charts can be easily prepared in MS Project (MSP), but they are very plain and rudimentary in their default form. That said, MSP provides ways to customize and improve Gantt charts for making them more presentable.
In my previous article, I talked about four methods, which can be used to customize Gantt charts in MSP. The first method we talked about was customizing Gantt charts by using the ‘Bar Styles’ feature of MSP. In this article, we will take a deeper look at ‘Bar Styles’ and combine them with milestones to create Milestone charts. Milestone charts are much better than simple Gantt charts for presenting project status as they depict the status much more succinctly.
Before reading further, I would suggest you to look at the MPUG article on Creating Milestone Reports in Microsoft Project. It shows a picture of a Milestone chart, and here we will endeavor to create a similar chart by using Gantt chart and milestone combination.
Project Milestones
What is a Milestone?
Cambridge dictionary defines a milestone as “a stone or post at the side of the road that shows the distance to various places, especially to the nearest large town.” While travelling on a road, you likely see a milestone and just pass it by without stopping. Similarly, a project milestone is a significant event or achievement. It is a specific point in project lifecycle.
Below are a few examples of project milestones:
- Project or phase kick-off dates
- Product rollout date
- Project deadlines
The Importance of Milestones
It is very important to define and communicate milestones to the stakeholders including team members, senior management, vendors, and customers.
Following are some of the reasons for defining and communicating the milestones:
- They are easily understood by everyone and present the top level view of the project.
- Everyone gets to know about the important project dates/events.
- It is very easy to communicate project status using milestones.
- They can be used for identifying dependencies / project risks.
- They provide a sense of accomplishment to the team members.
Milestones in MS Project
In MSP, by default, a task is represented as a line (bar) and a milestone is represented as a diamond. Refer to the Figure below to see a task and milestone.
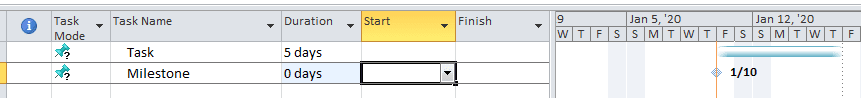
Figure I – Task and Milestone
MSP considers any task with zero duration as a milestone, but you can also make non-zero duration tasks milestones. For example, client approval is a process that can take a few days, so you may want to make it a milestone.
You can follow the below mentioned steps to make non-zero duration tasks milestones:
- Select the task you want to make a milestone.
- Right-click on the task and click ‘Information.’ Alternatively, you can click on ‘Information’ in the ‘Properties’ group in the main menu. Refer to Figures II and III below.
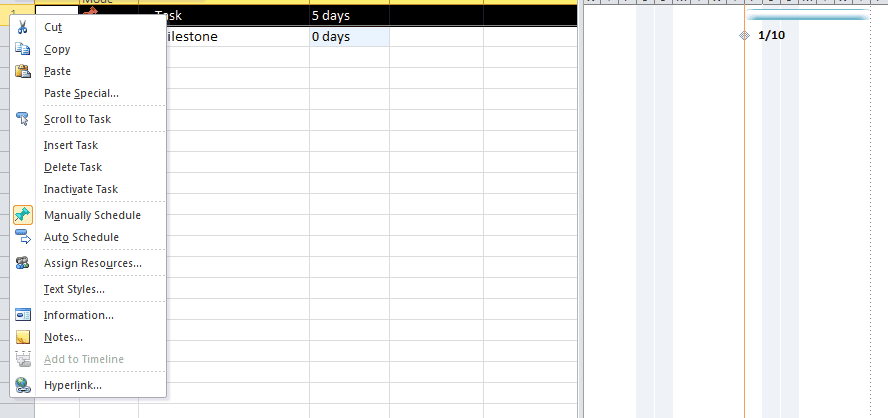
Figure II – Right-Click to Open Task Information Dialog

Figure III – Top Menu to Open Task Information Dialog
3. Click the ‘Advanced’ tab. Refer to the Figure below.

Figure IV – Advanced Tab of Task Information Dialog
4. Check ‘Mark task as milestone,’ and then click OK. Examples of milestones with zero duration and non-zero durations are shown in the Figure below.
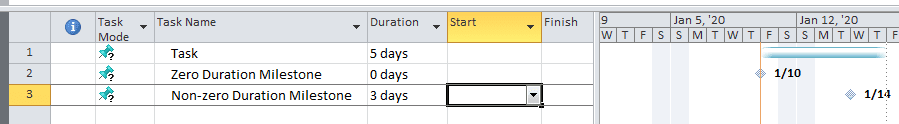
Figure V – Task and Two Milestones
You will notice that a both zero-duration and non-zero duration milestones have a diamond shape, which makes it impossible to find the duration of a milestone from only its shape. This is not very intuitive as you cannot visually differentiate between zero-duration and non-zero duration milestones.
Customizing Bar Styles
The default Gantt chart view in MSP has some limitations, but these can be overcome by using the ‘Bar Styles’ feature.
The ‘Bar Styles’ dialog box can be opened either by right-clicking anywhere in the blank area in the Gantt chart view and choosing the ‘Bar Styles’ or by clicking at the bottom right of Format->Gantt Chart Style. Refer to Figures VI and VII below.

Figure VI – Format menu
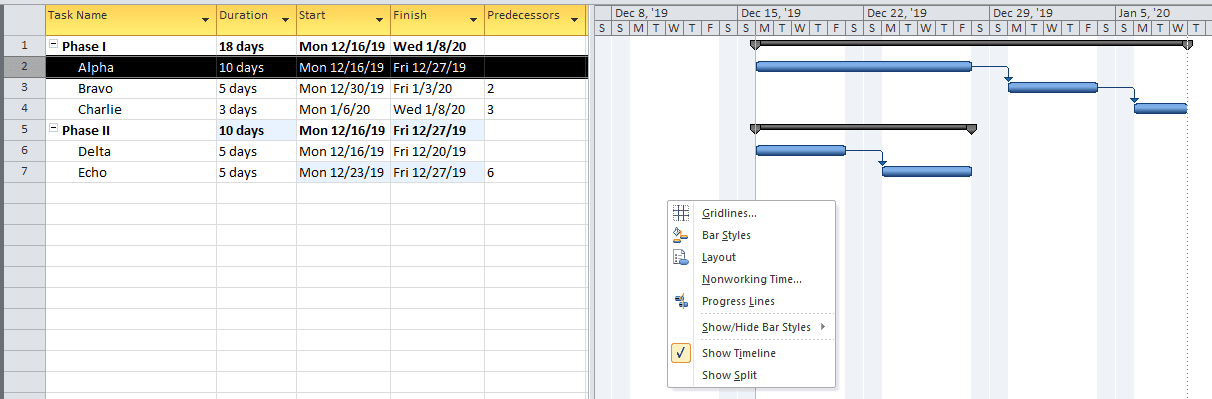
Figure VII – Right-click context menu
The ‘Bar Styles’ dialog box is shown in Figure VIII below. You can define your own task types by using this dialog box. You can also change color, shape, pattern, and few other bar properties of standard and custom task types.
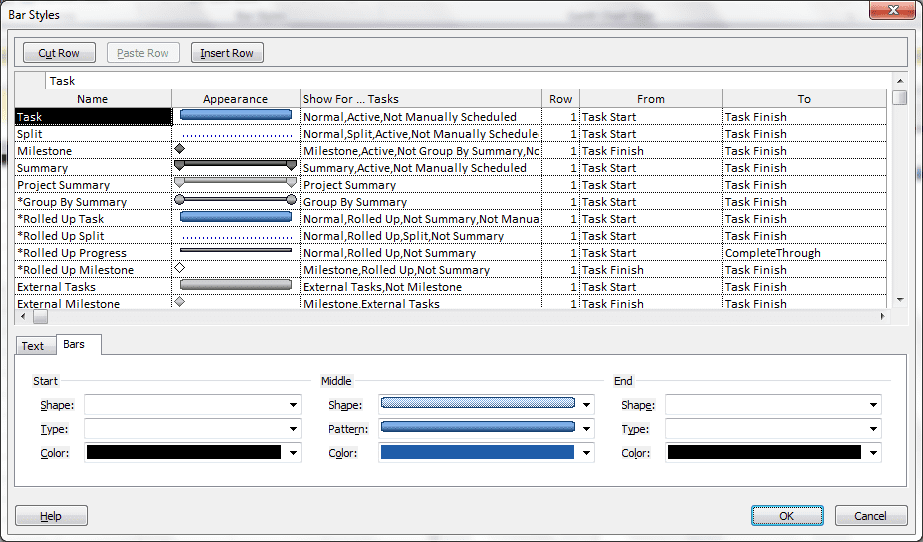
Figure VIII – Bar Styles
There are two parts of the ‘Bar Styles’ dialog box. They are the upper part, which displays a table, and lower part which is used to customize the bars.
The upper part of the dialog box has following fields:
- Name – This column lists the name of standard and custom task types. Standard types are shown in the table, while custom types can be added by inserting a new row in the table. For example, in our case, standard and custom types could be ‘Milestone’ and ‘Unfinished Milestones.’
- Appearance – This column displays how the bar will look. The appearance can be customized by using the lower part of the dialog box. You can use various shapes and color.
- Show for Tasks – This column lists the properties of a task. You can customize a bar for various properties with ‘Not Started’, ‘Finished Late’, ‘Critical,’ etc. Refer to Figure IX below.
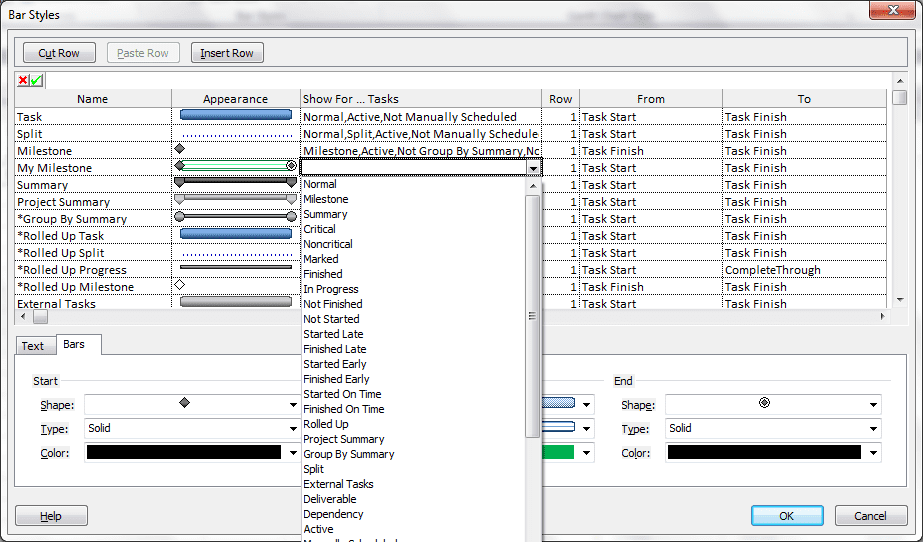
Figure IX – Customizing Bar Styles
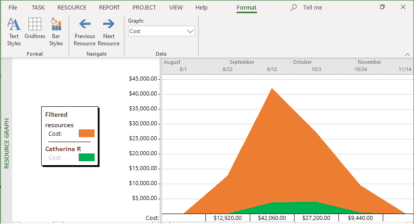
4. Row – This displays the number of bars to be shown for a task type. You can show up to four bars for a particular task type. This helps in showing the current status of a task. For example, Row 1 can be used for showing baseline dates, while Row 2 could be used for the current schedule. Refer to Figure X below.
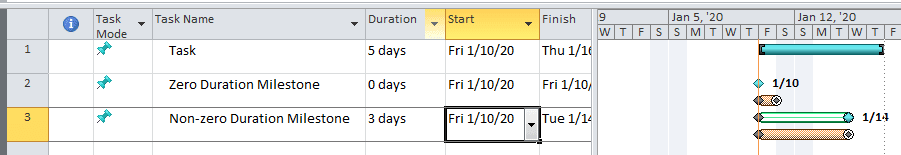
Figure X – Customized Gantt Chart
5. From and To – This one lists the Start and Finish of a bar.
Note: You can customize ‘Bar Styles’ of the Tracking Gantt chart view, also. A Tracking Gantt is much more useful for status reporting and presentations.
Filters and Print Legends
There are several other options for making presentation reports:
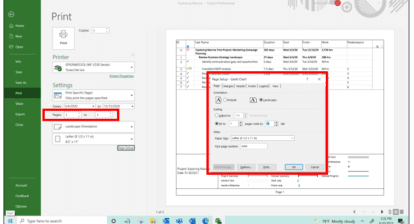
- Use the filter option in MSP to show only Milestone tasks. Refer to Figure XI below.
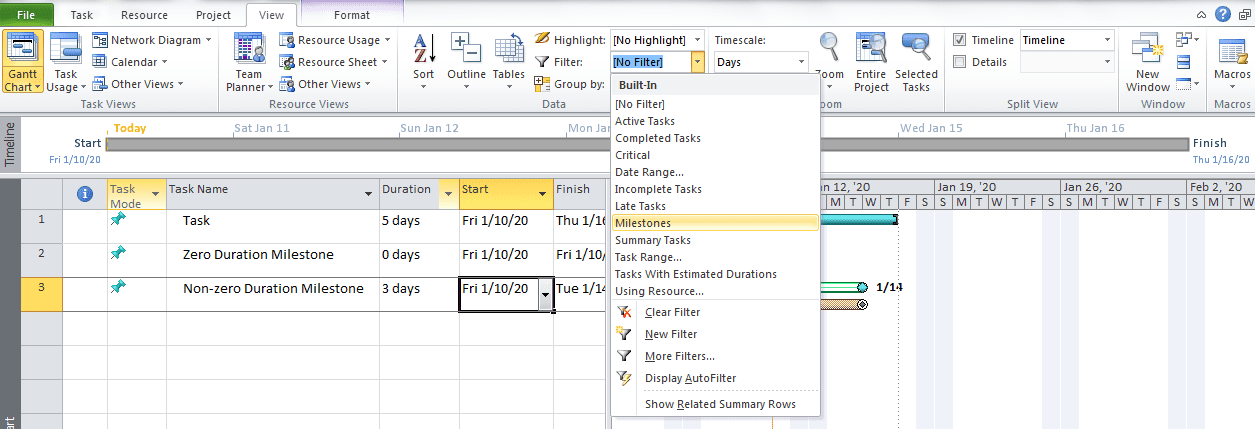
Figure XI – Task Filter
2. You can also change the legends shown in the printed version. Refer to another article that provides information about changing legends in MSP.
Conclusion
Milestone charts are extremely useful for presentations and reporting. Senior management and customers can easily make out the project status by just looking at them. Before presenting milestone charts, you should standardize the colors and legends to avoid any confusion. Start using the advanced formatting features of MSP like ‘Bar Styles’ and ‘Filters’ to make Milestone charts.
What type of visual reports do you use for making presentations to senior management and customers? Do you think Milestone charts are more useful?
I would love to hear your thoughts in the comments below.


Jose Zaldivar
nicely done! thanks for the quick reminder. We get paid when we achieve a milestone 🙂