Return On Invested Capital, or ROIC, is a common metric used as an input for developing strategy, selecting projects, and measuring project, program, and business performance. This post explores the definition of ROIC, how to compute it, and its usefulness in strategy and project management.
Return On Invested Capital Definition
 Return on Invested capital can be defined in some slightly different ways, but they all seem to converge on one general meaning. Here’s how Investopedia defines ROIC:
“Return on invested capital (ROIC) determines how efficiently a company puts the capital under its control toward profitable investments or projects.”
Most definitions seem to incorporate three primary elements:
- Profitability and/or performance metrics
- Measure of return that owners or investors are earning from their invested capital
- Efficiency with which the company’s managers are using investor funds to generate income
The measure can tell you how well a company is doing, and can tell you the potential or actual results for a project.
Let’s dig a little deeper and look at the formula for Return On Invested Capital calculation:
ROIC = (Cash flow from operations) / (Value of invested capital)
Here’s a little more detail on the components:
- Cash flow from operations: All income minus expenses related to operations. Items that are not related to operations need to be excluded, as they will skew the metric and can misguide thinking.
- Value of invested capital: Company equity + long term debt. The equity is what owners have invested in the company, and debt is additional capital deployed through borrowing.
The ROIC metric can be used on a company basis, as is normal practice, or even looked at specifically on projects or programs.
One of the references at the bottom provides a free downloadable ROIC spreadsheet template with an example.
The Value of ROIC In Practice
ROIC provides a measure how of well a company is doing, whether to evaluate the attractiveness as an investment, or to evaluate the effectiveness of the management team. Looking forward, it provides a metric that forecasts how attractive the investment is expected to be. Looking back in time, it provides a metric for how well the company and its management have performed. The two may or may not be related, as conditions can change – but it is informative to compare predicted vs actual results.
ROIC has additional power when you consider it as a benchmark. For example, particular industries have a benchmark ROIC. A company in the industry can be evaluated for their performance against the benchmark. This can help guide investment decisions, which will be executed by projects and programs.
The following are a sampling of five profitability metrics, expressed as average ROIC over the period 1992 to 2006, from “On Competition” by Michael Porter:
- Pharmaceuticals – 31.7%
- Semiconductors – 21.3%
- Household appliances – 19.2%
- Grocery stores – 16.0%
- Hotels – 10.4%
This shows the wide range of profitability, as measured by ROIC, across a small range of industries. The profitability of industries varies because of strategic factors discussed in the next section.
Strategic Perspective of ROIC
ROIC is a general measure of return in an industry. Hence, for a model such as Michael Porter’s Value Chain, for example, ROIC is the broadest and most informative measure of performance. It contains not only operational performance, but required investment to get that performance.
In addition, ROIC is the ideal measure of the attractiveness of an industry. It can capture the quantitative implications of the Porter’s Five Forces framework, where it is informative to analyze the effects of the following on profitability:
- Supplier bargaining power
- Buyer bargaining power
- Threat of new entrants
- Threat of substitute products
- Intensity of competitor rivalry
The degree to which each of these restricts profitability in the industry directly reflects on a company’s financial performance, which can be measured by ROIC.
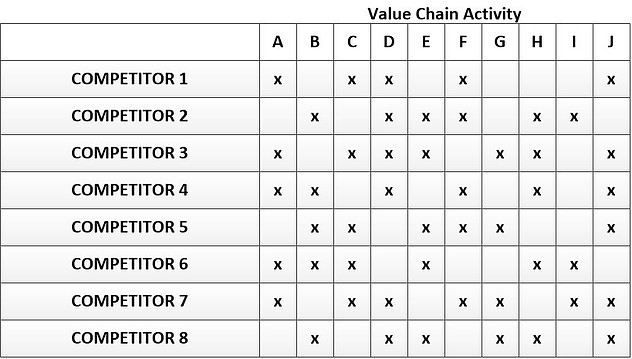
While all competitors within an industry are subject to these same forces, each also has opportunities to differentiate. The following graphic illustrates how each hypothetical competitor in a given industry competes with a different mix of activities across the value chain:
There are many value chain activities – anything that adds value – from which companies can choose. Strategic choices will be based on innovation, understanding of the customer, and selection of which customer needs to serve. Activities are in areas like customer service, delivery, advertising, ordering, assembling, and the like. This is similar to the Blue Ocean approach of selecting value added attributes to match customer needs while differentiating from the competition.
The strategic choices made by each competitor will determine their financial performance. Good strategic choices will result in performance better than the industry average ROIC, where poor choices will result in lower performance.
The point is that strategic positioning relates directly to ROIC.
ROIC and Projects, Programs, and Portfolios
When projects are considered, often cash flow projections are run. These will include the amount of expected investment, expected cash flows that will result from the investment, and the timing of the investment outflows and resulting cash inflows.
Here are some nuances about projects, programs, and portfolios to consider:
- Projects: Not all projects should necessarily be expected to have an attractive return, which can be measured by ROIC. Some projects will be required because of regulation and will simply be a cost of doing business. Other projects might be to simply learn, or discover, something, and thus provide an input to other projects or programs. Also, many projects could be for implementing best practice operational improvements, while other projects will involve implementing strategic initiatives. These two types of projects will likely have different expected returns.
- Programs: Programs have some similar nuances to projects in terms of types of projects and differing returns. However, since programs are broader initiatives than projects, it is more likely that you will be able to forecast an aggregated expectation for the program and develop more meaningful metrics for returns. These metrics should help to tell you whether to do a program (or project as part of the program) or not.
- Portfolios: At the portfolio level, you are aggregating across all the projects. Therefore, the most meaningful metrics are at the portfolio level, and not as much at the project or program level. The goal should be to develop a portfolio that has a meaningful return on an aggregated basis. The idea is to not necessarily expect returns on each project to be at a certain level. It is better to define and interconnect projects and programs that, as a whole, will produce the expected returns.
Projects, programs, and portfolios are interconnected and need to, as a whole, produce the desired results. ROIC provides a great metric for those results.
In a project centric organization – where the business of the organization is executing projects – each project will contribute to the total return of the business. In this case, projects are the operations.
In a business where projects are executed to produce change in the business, but do not actually generate revenue for the business, the projects serve the operations. Care must be taken to ensure that projects are measured such that they produce the kind of change in the operations that generates attractive returns relative to the costs of the projects.
Where to Learn More About ROIC
The following are links to learn more about Return On Invested Capital (ROIC):
“Return on Invested Capital (ROIC)“, Investopedia
“What Is ROIC?”, Corporate Finance Institute (CFI). Includes ROIC spreadsheet template.

