
As an agency, profitability depends greatly on accurately tracking and understanding your company’s key metrics and data. This includes not just financial metrics, but also operational, sales, and project management data.
In this guide, we’ll walk you through 16 key agency metrics and KPIs to know and track to improve your agency’s profitability.
Financial metrics
Financial metrics are critical for your agency to understand income, revenue, profit, and costs. If you’re new to tracking metrics, these are good ones to start with.
1. Total revenue
Total revenue is the amount your agency earns from client projects and services in a given period before accounting for any expenses or costs.
It is calculated by summing up all the invoices you send to clients in that time period.
For example, if you invoiced three clients in Q1 for:
- Client A: $180,000
- Client B: $45,000
- Client C: $25,000
Your total revenue for Q1 would be $250,000 ($180,000 + $45,000 + $25,000).
Tracking total revenue is crucial because it shows how much money flows into your agency. It provides a top-line view of income before you factor in any costs.
However, tracking revenue and invoices can be a messy process. Accounting software is often disconnected from other company tools, making this metric difficult to find.
All-in-one agency management tools, like Scoro, make it a lot easier.
In Scoro, click the “Reports” module from the top header menu.
Here, you’ll see a list of reports you can use for your agency. To filter them to see the total income, click on the “Summary” report under the “Financial” section. And then, select the period you want to review.
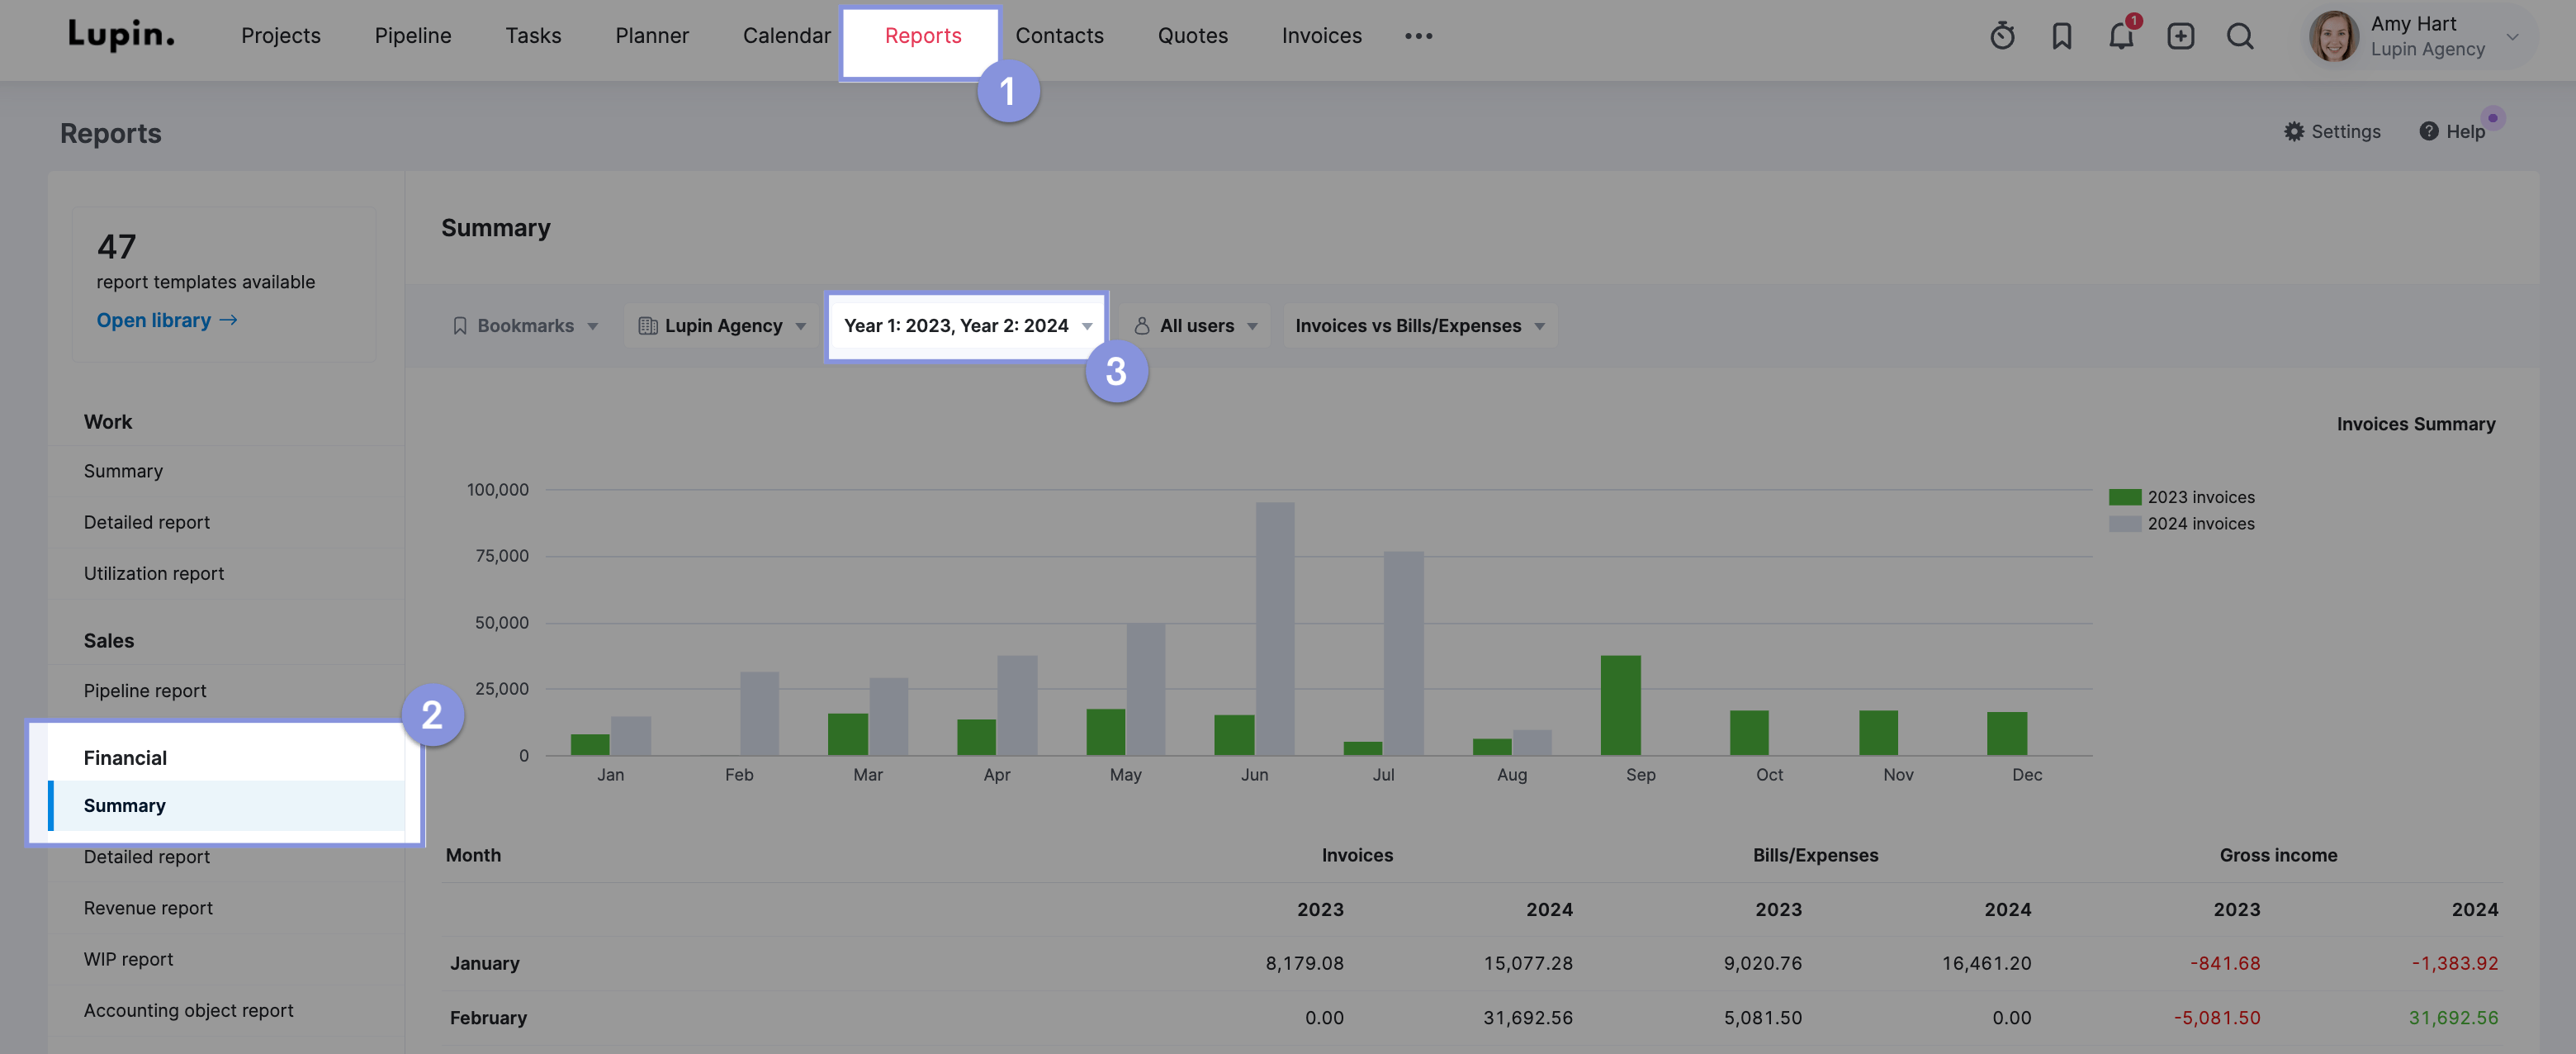
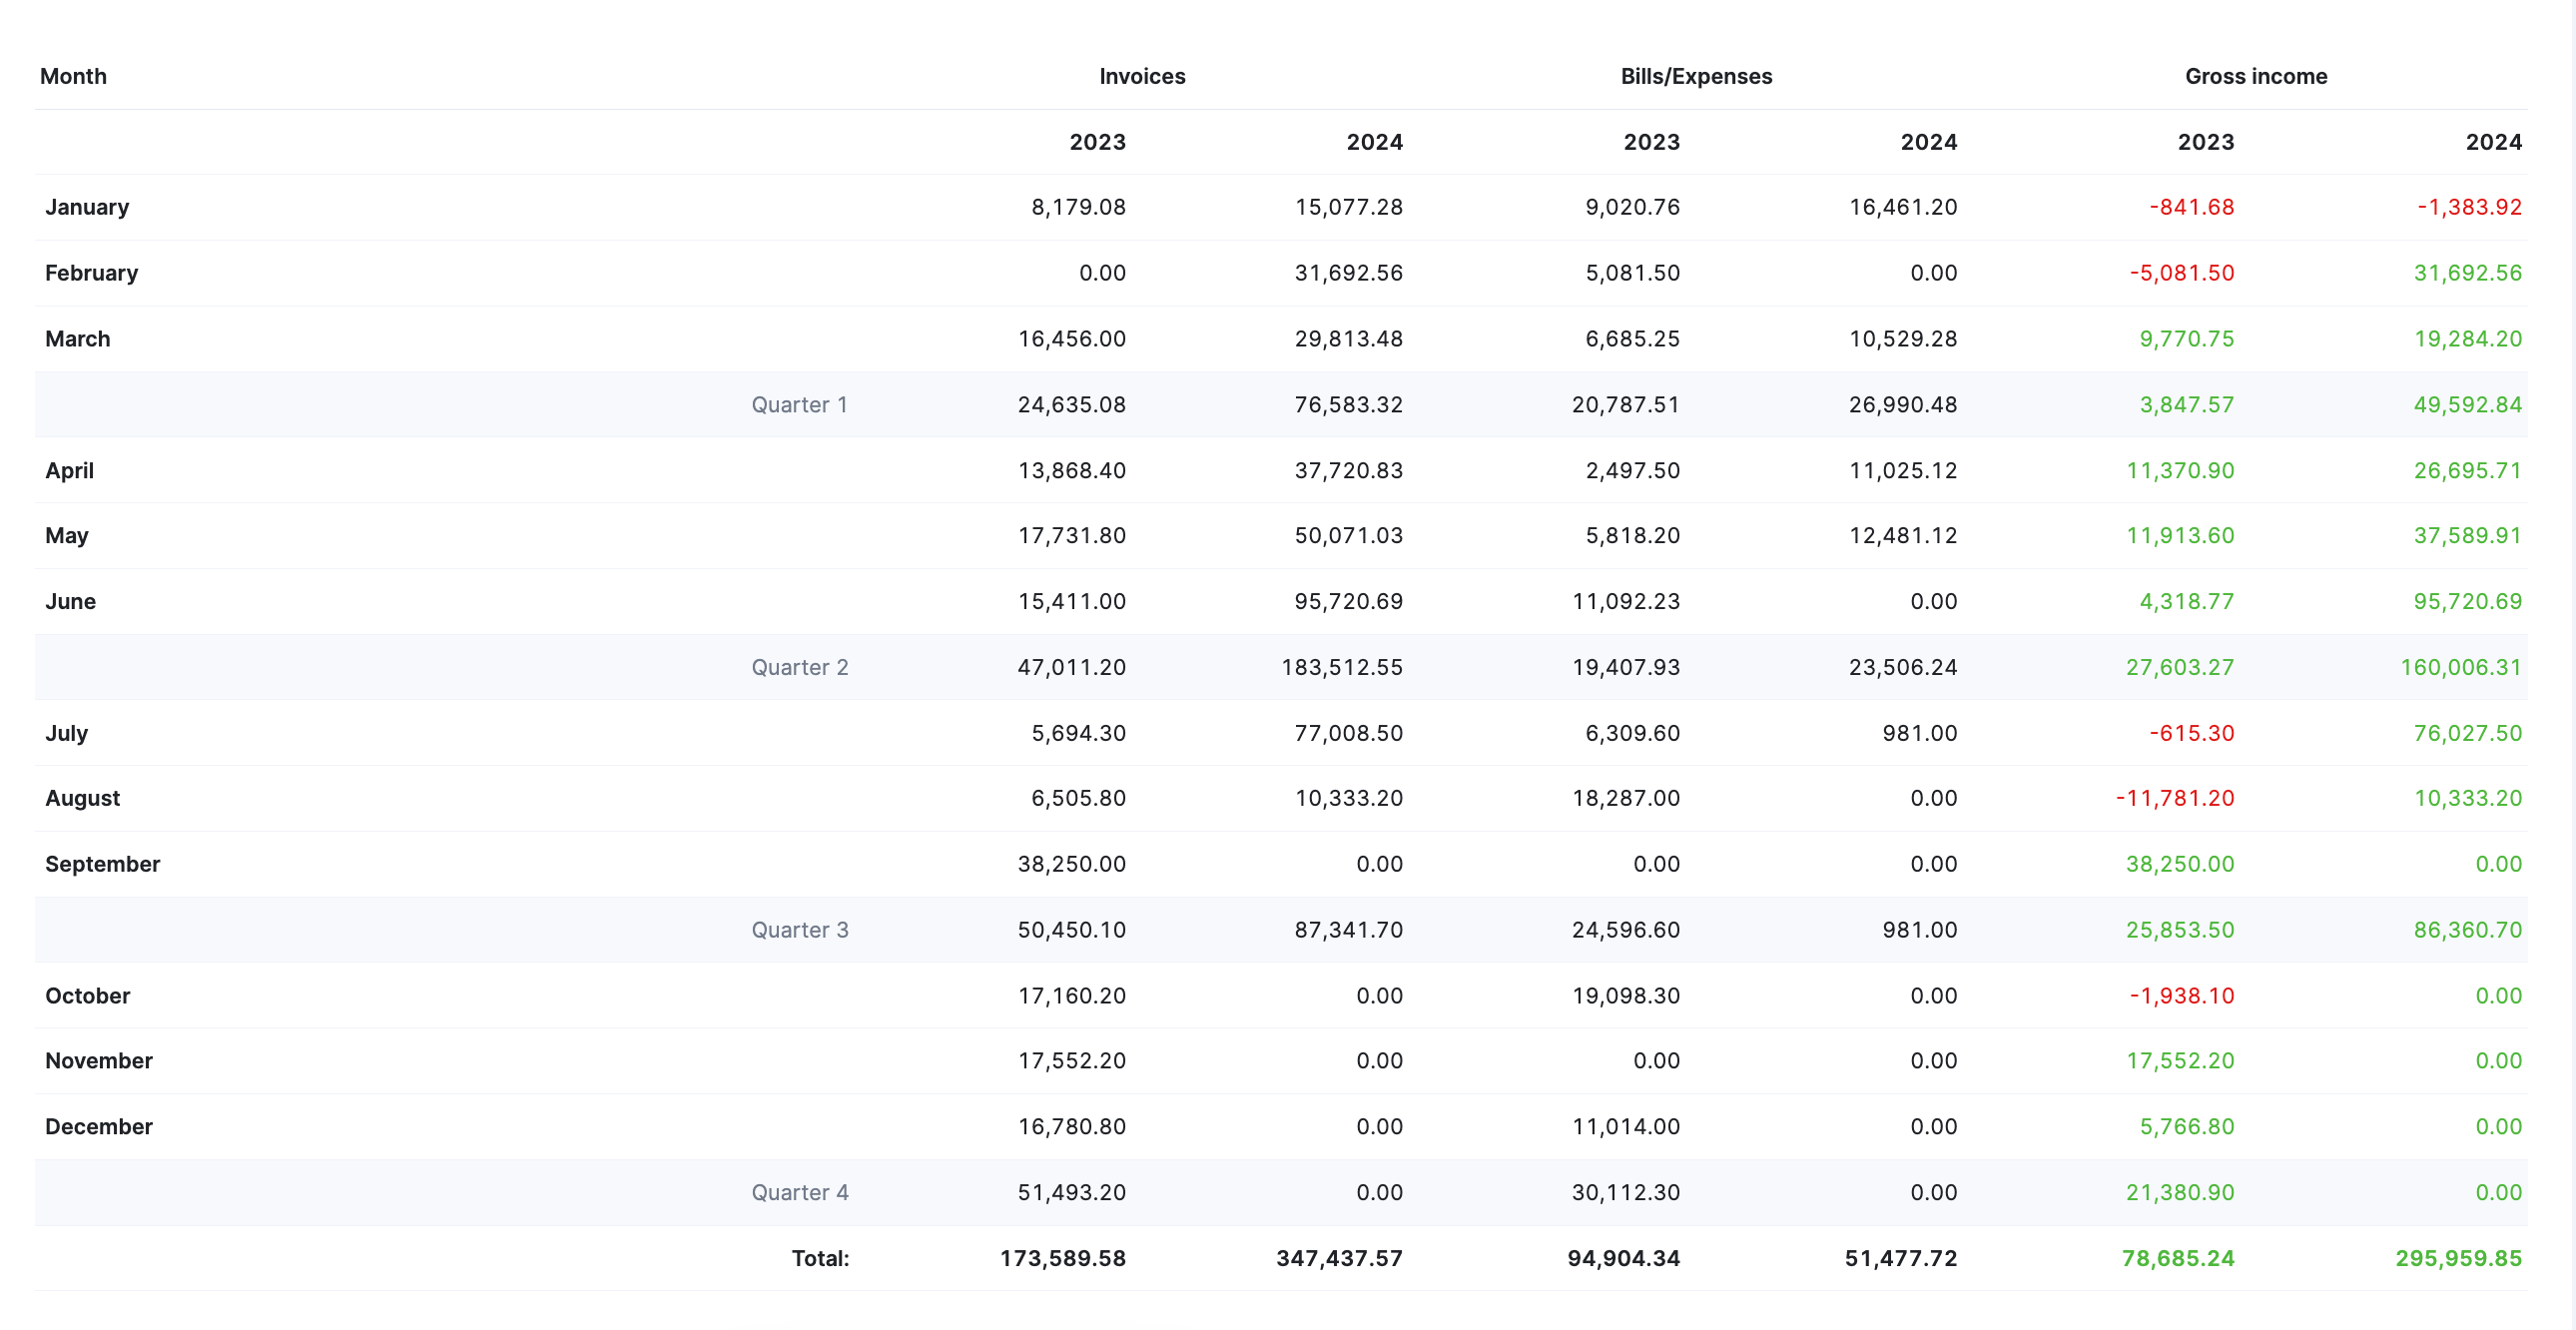
This report will show a breakdown of invoices (revenue) versus expenses for all projects over the selected time period. It will also display the gross income generated, broken down by month and quarter.
Further Reading: Detailed Financial Report in Scoro
2. Gross income
Gross income is the total income minus pass-through costs (bills and expenses).
For example, let’s say you have $250k of total income. You have $40k in bills (equipment and licenses) from those projects and $10k in expenses (such as contractor costs).
$250k income – $40k bills – $10k expenses = $200k in gross income
Gross income is crucial to understand how much you’re actually earning. If you only look at total revenue without considering pass-through costs, you may overestimate your agency’s financial health and profitability.
For example, if an agency has $1 million in revenue, but $500,000 goes to contractors and expenses, their gross income is only $500,000. The agency has much less money to cover salaries, rent, and other operating costs than its total revenue implies.
In Scoro, gross income is calculated automatically, so you can skip all the calculations and get the necessary data.
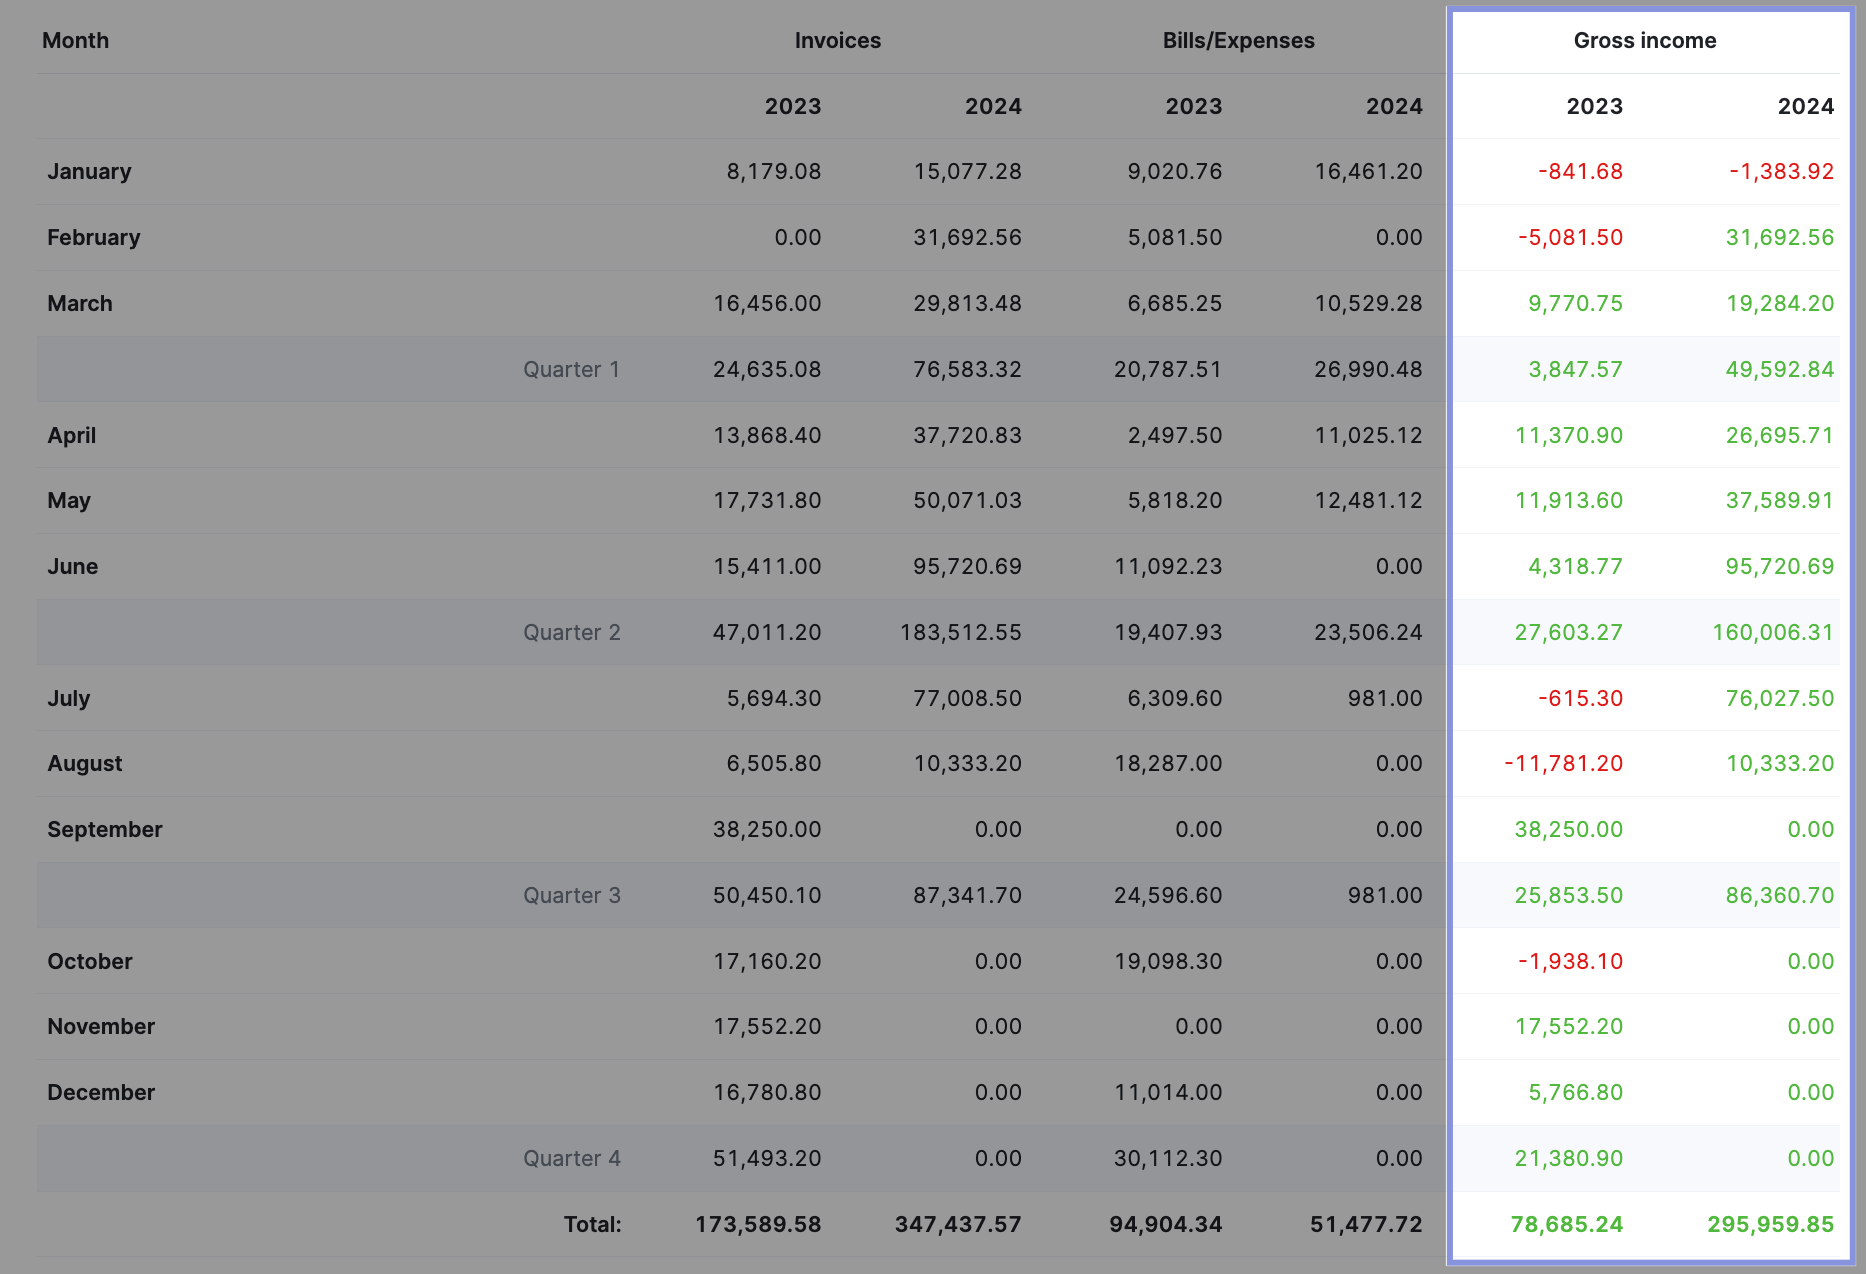
You can look at the same “Summary” report.
You can also view gross income in Scoro by project by going to the “Project list” view in the “Projects” module.
In the “Data columns” dropdown, check “Gross income.”
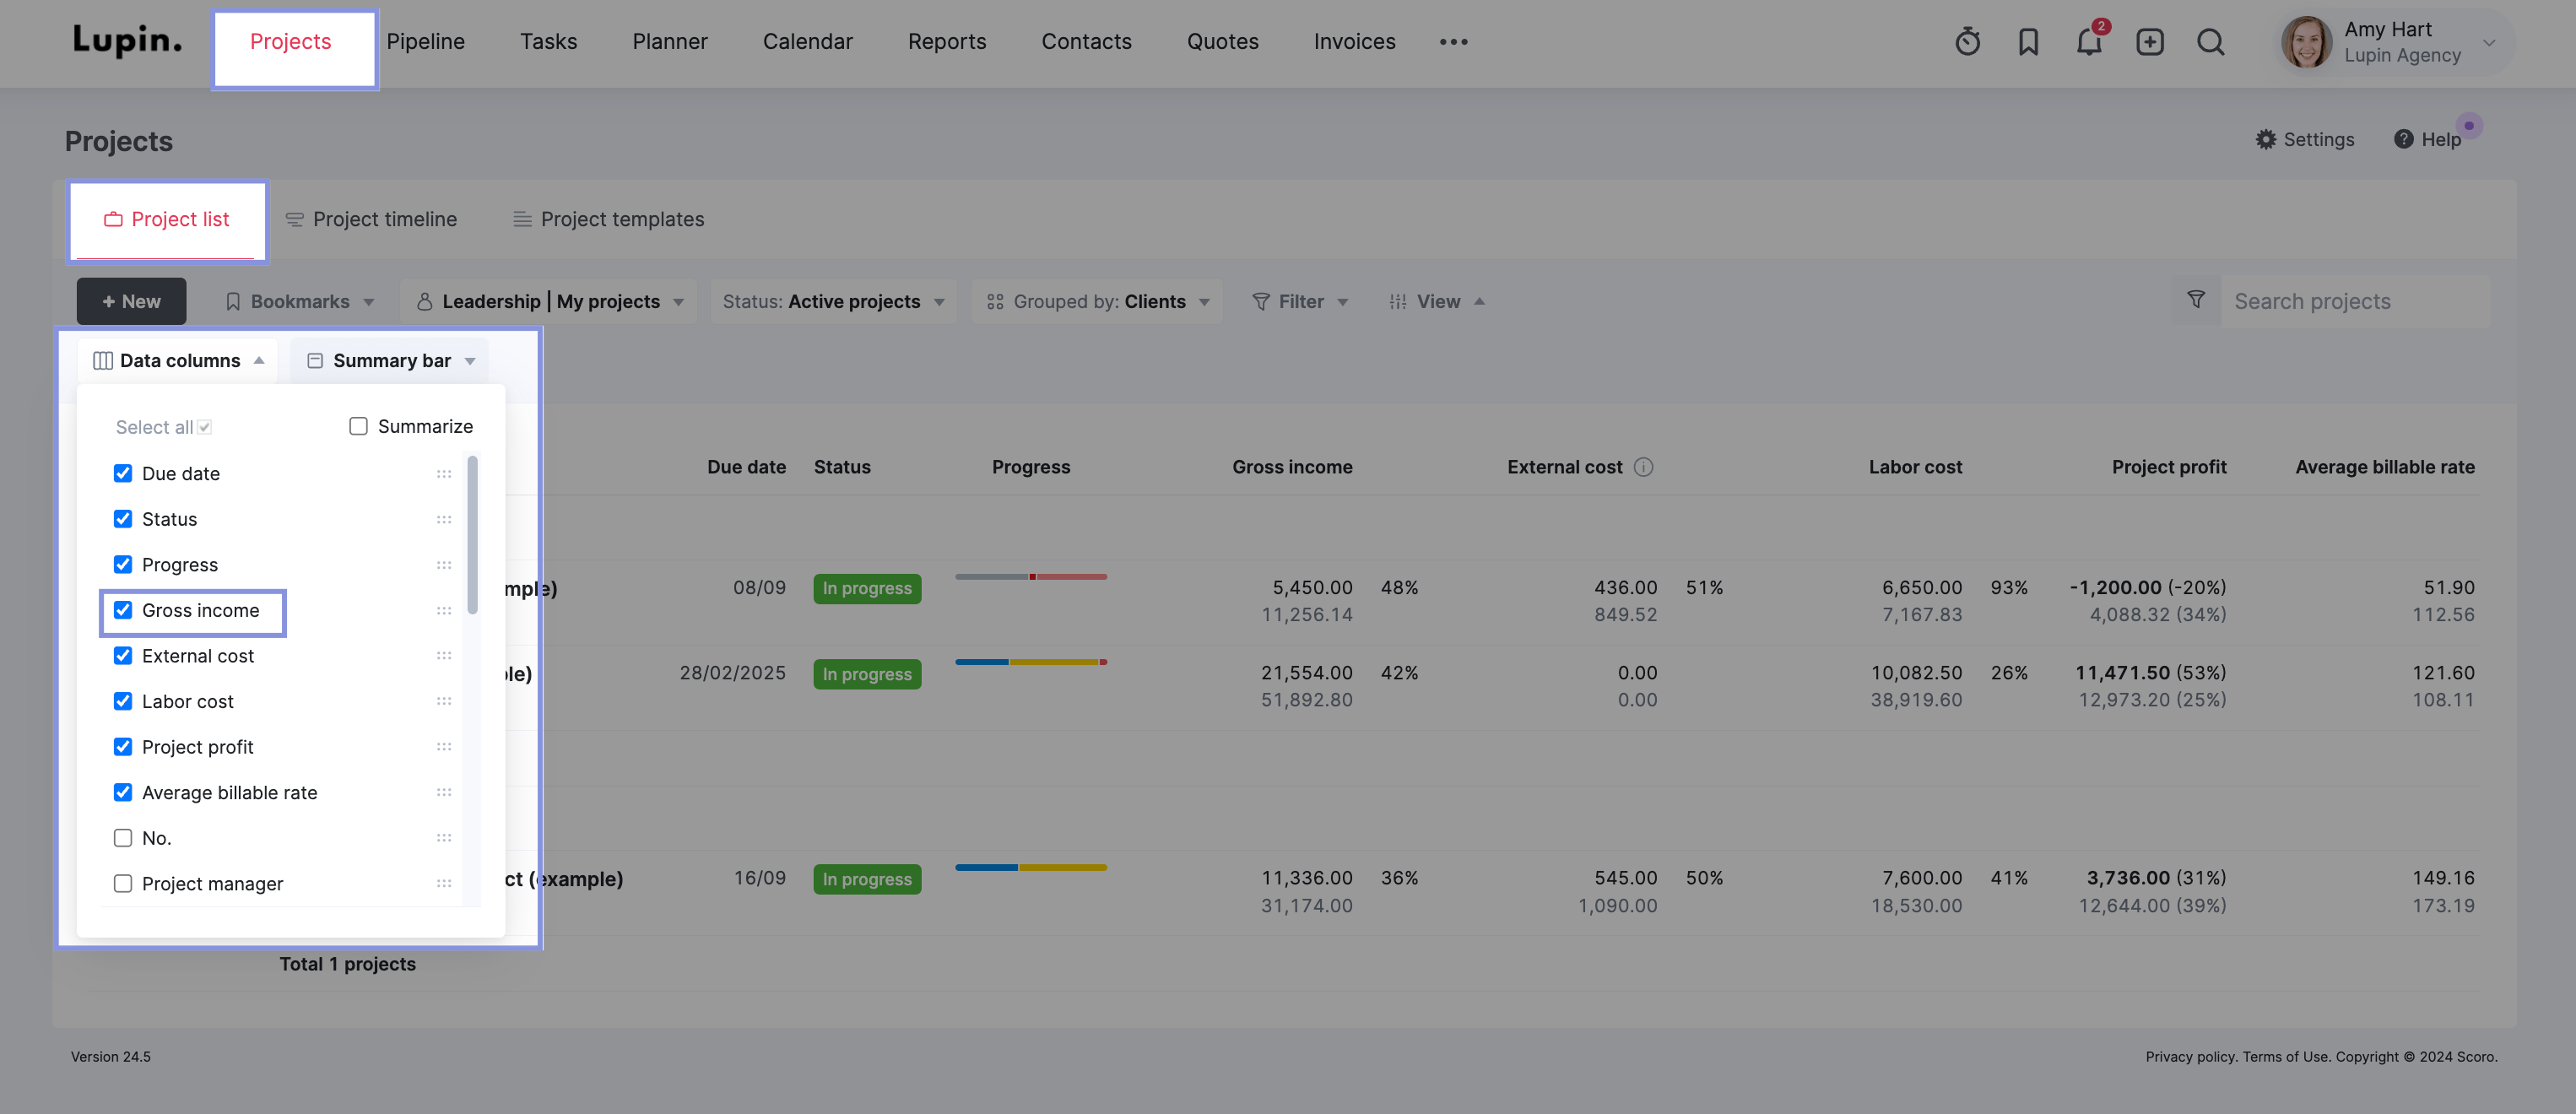
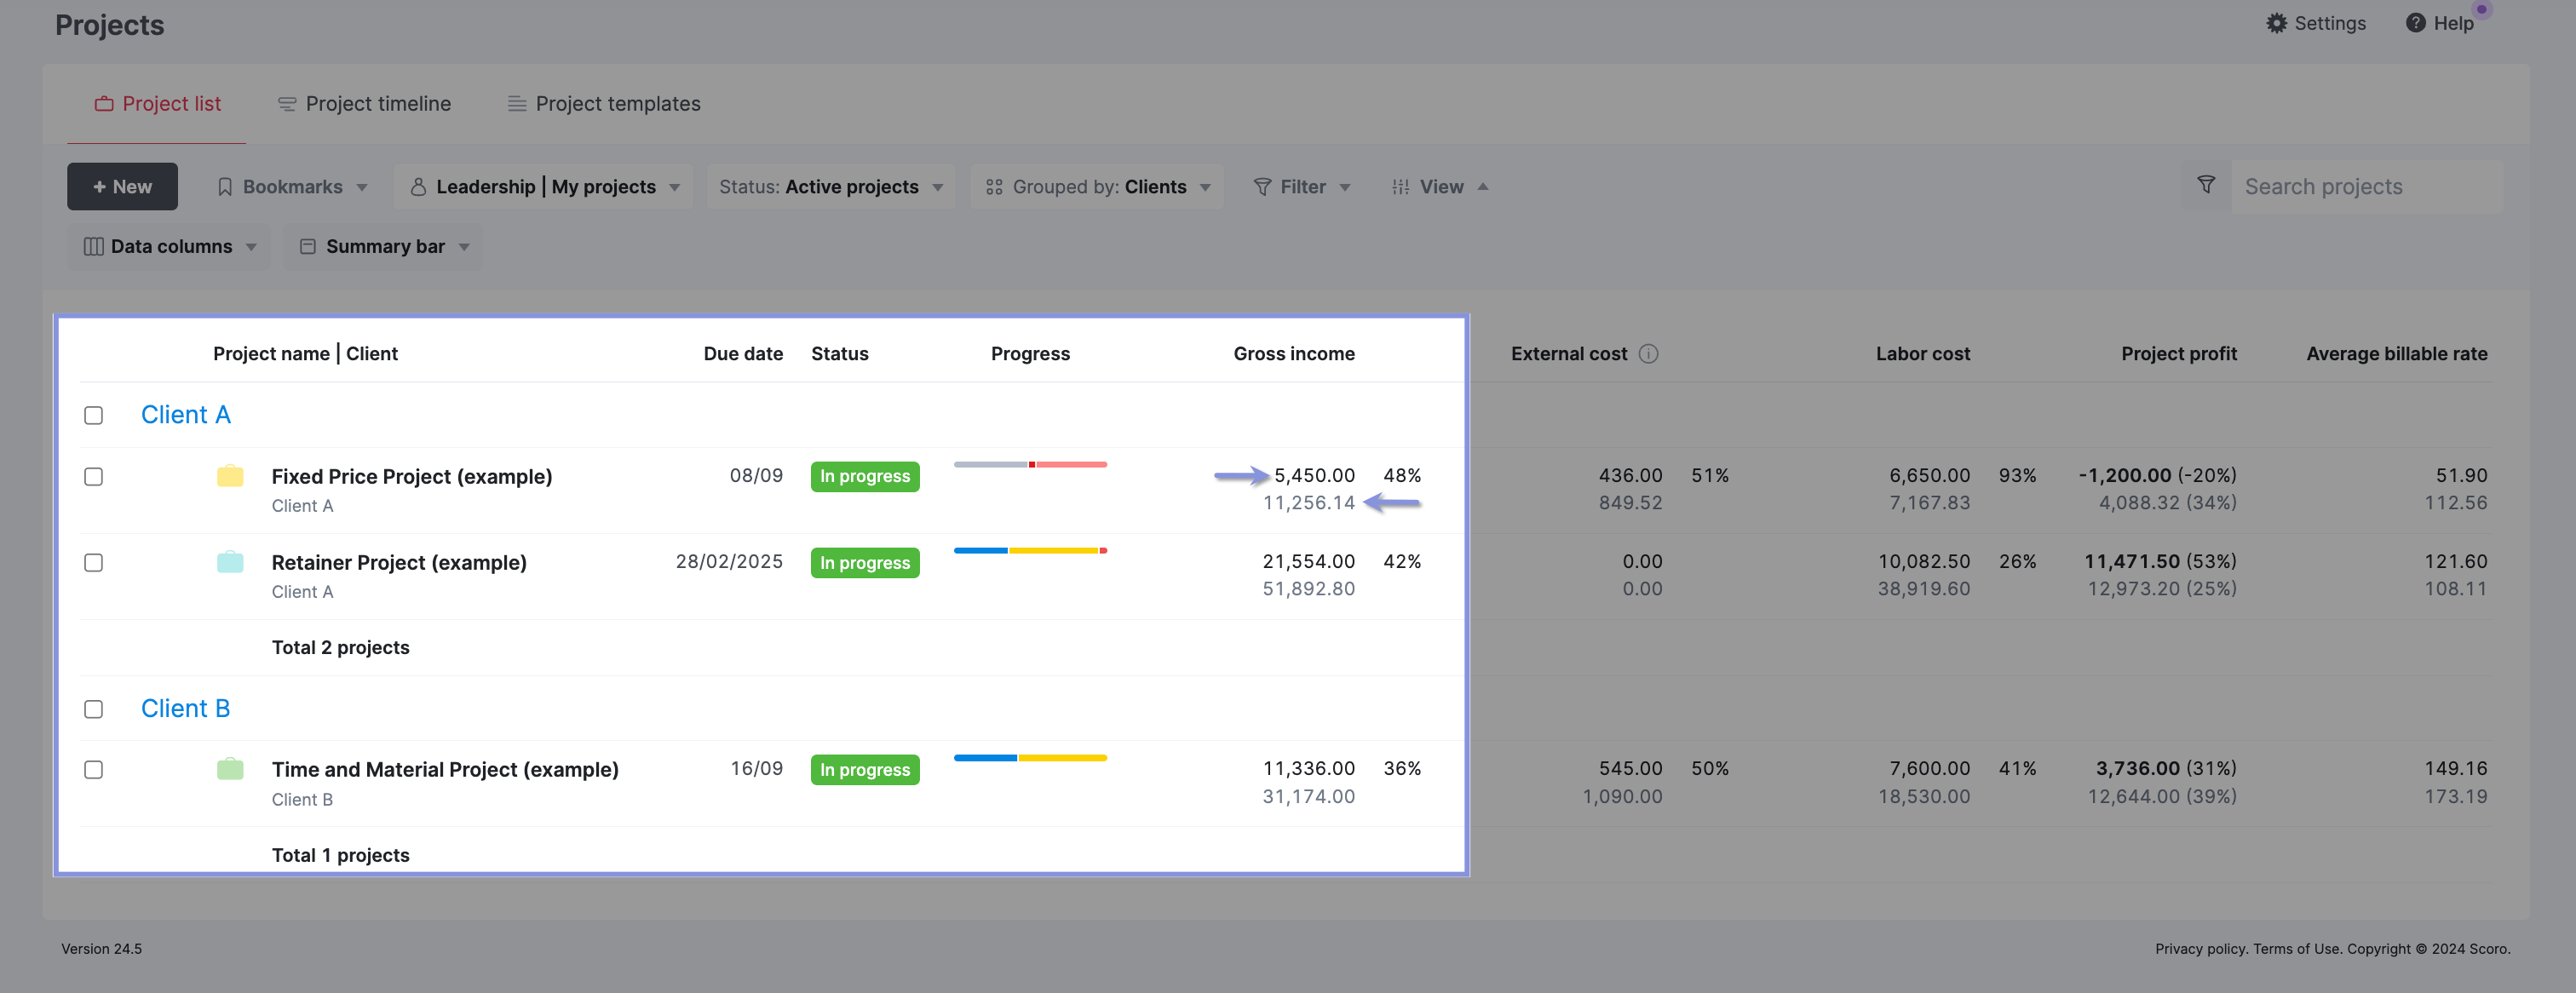
The total gross income is displayed and broken down by project. This can help you understand which projects generate the most income after accounting for expenses.
For each project, there are two amounts shown:
- The quoted amount (displayed in grey)
- The actual amount (displayed in black)
3. Labor cost
Labor cost is the amount a company spends on each worker per hour.
To calculate an employee’s hourly labor cost:
Hourly Labor Cost = (Annual Salary + Benefits + Other Costs) / Annual Hours Worked
For example, let’s say you have a group of employees with the following costs:
- Annual salary: $90,000
- Benefits: $7,500
- Trainings and other costs: $7,540
Each employee costs your agency $105,040 annually.
Assuming they work 2,080 hours per year (40 hours per week for 52 weeks), their hourly labor cost would be:
$105,040 / 2,080 hours worked = $50.5 hourly labor cost
This means that every hour the employee works costs your agency $50.5, regardless of whether that time is billable to a client.
Labor costs are essential for calculating delivery margin, understanding how much each project costs you internally to deliver, and calculating profit accurately.
In Scoro, you can set custom labor costs for each employee or role to calculate a more accurate delivery margin.
First, input the hourly labor costs for each team member by clicking “Settings” in the top right-hand corner, followed by “Labor cost.”
You can enter a default hourly rate for your team, by role, or by individual team member.
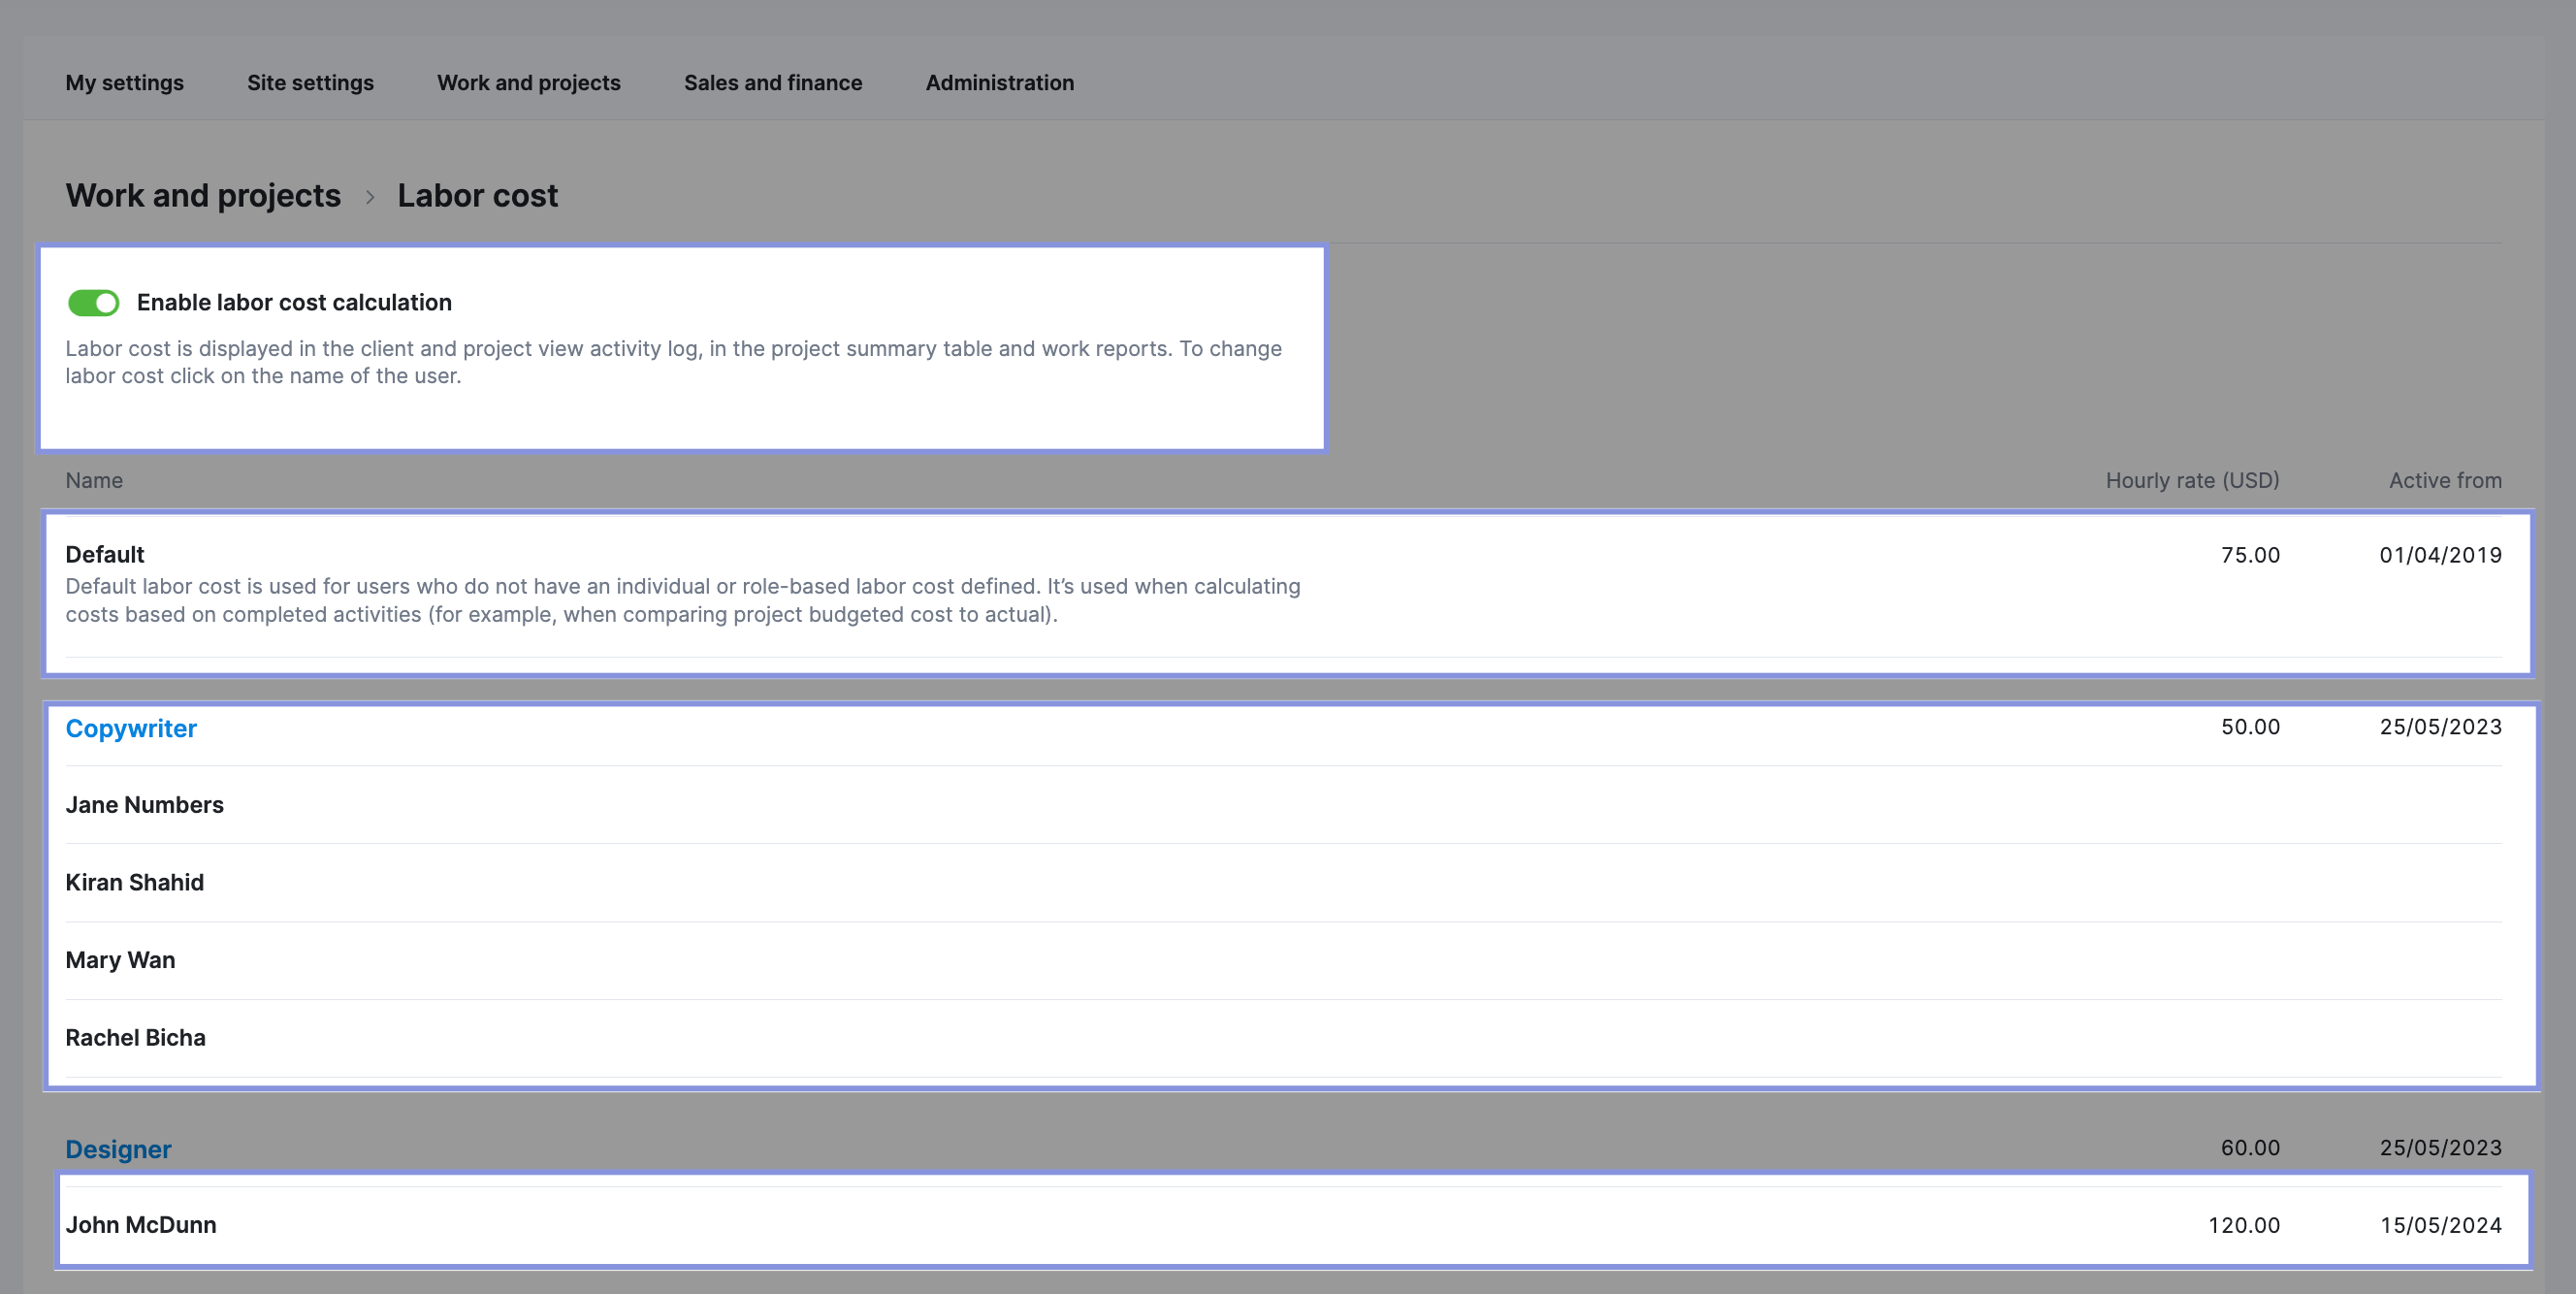
Scoro will calculate project labor costs using your team’s hourly rates when tracking time against project tasks.
Further Reading: Setting Up Labor Rates in Scoro
4. Delivery margin
Delivery margin shows you the percentage difference between your profit and gross income.
The formula to calculate delivery margin looks like this:
Delivery Profit Margin % = ((Gross Revenue – Delivery Costs) / Gross Revenue) x 100
Where:
- Gross Income = Total Revenue – Pass-Through Costs
- Delivery Costs = Internal labor costs (payroll)
Let’s say your agency had $300,000 in gross income for a project after subtracting $75,000 in pass-through costs from $375,000 in total billings.
To complete that project work, you incurred $180,000 in delivery costs.
Using those numbers, here’s how we calculate the delivery profit margin:
- Gross Revenue = $300,000 Delivery Costs = $180,000
- Delivery Profit Margin % = (($300,000 – $180,000) / $300,000) x 100 = 40%
So, in this example, your agency spent 60% ($180,000) of the $300,000 gross revenue on internal delivery costs, leaving 40% ($120,000) as profit.
Of course, tracking your delivery margin is crucial because no business can exist without making a profit.
A good delivery margin to aim for is 55% – 75%. This range indicates efficient pricing and cost management and helps ensure profitability.
Further Reading: Calculating Agency Margins: A Beginner’s Guide
Delivery margin can also help you understand profitability on a project level, allowing you to make data-driven decisions about which types of projects and clients drive the most profit.
If you’re calculating all of this manually, there’s a lot of numbers to keep track of:
- Total income
- Gross income
- Pass-through costs
- Labor costs
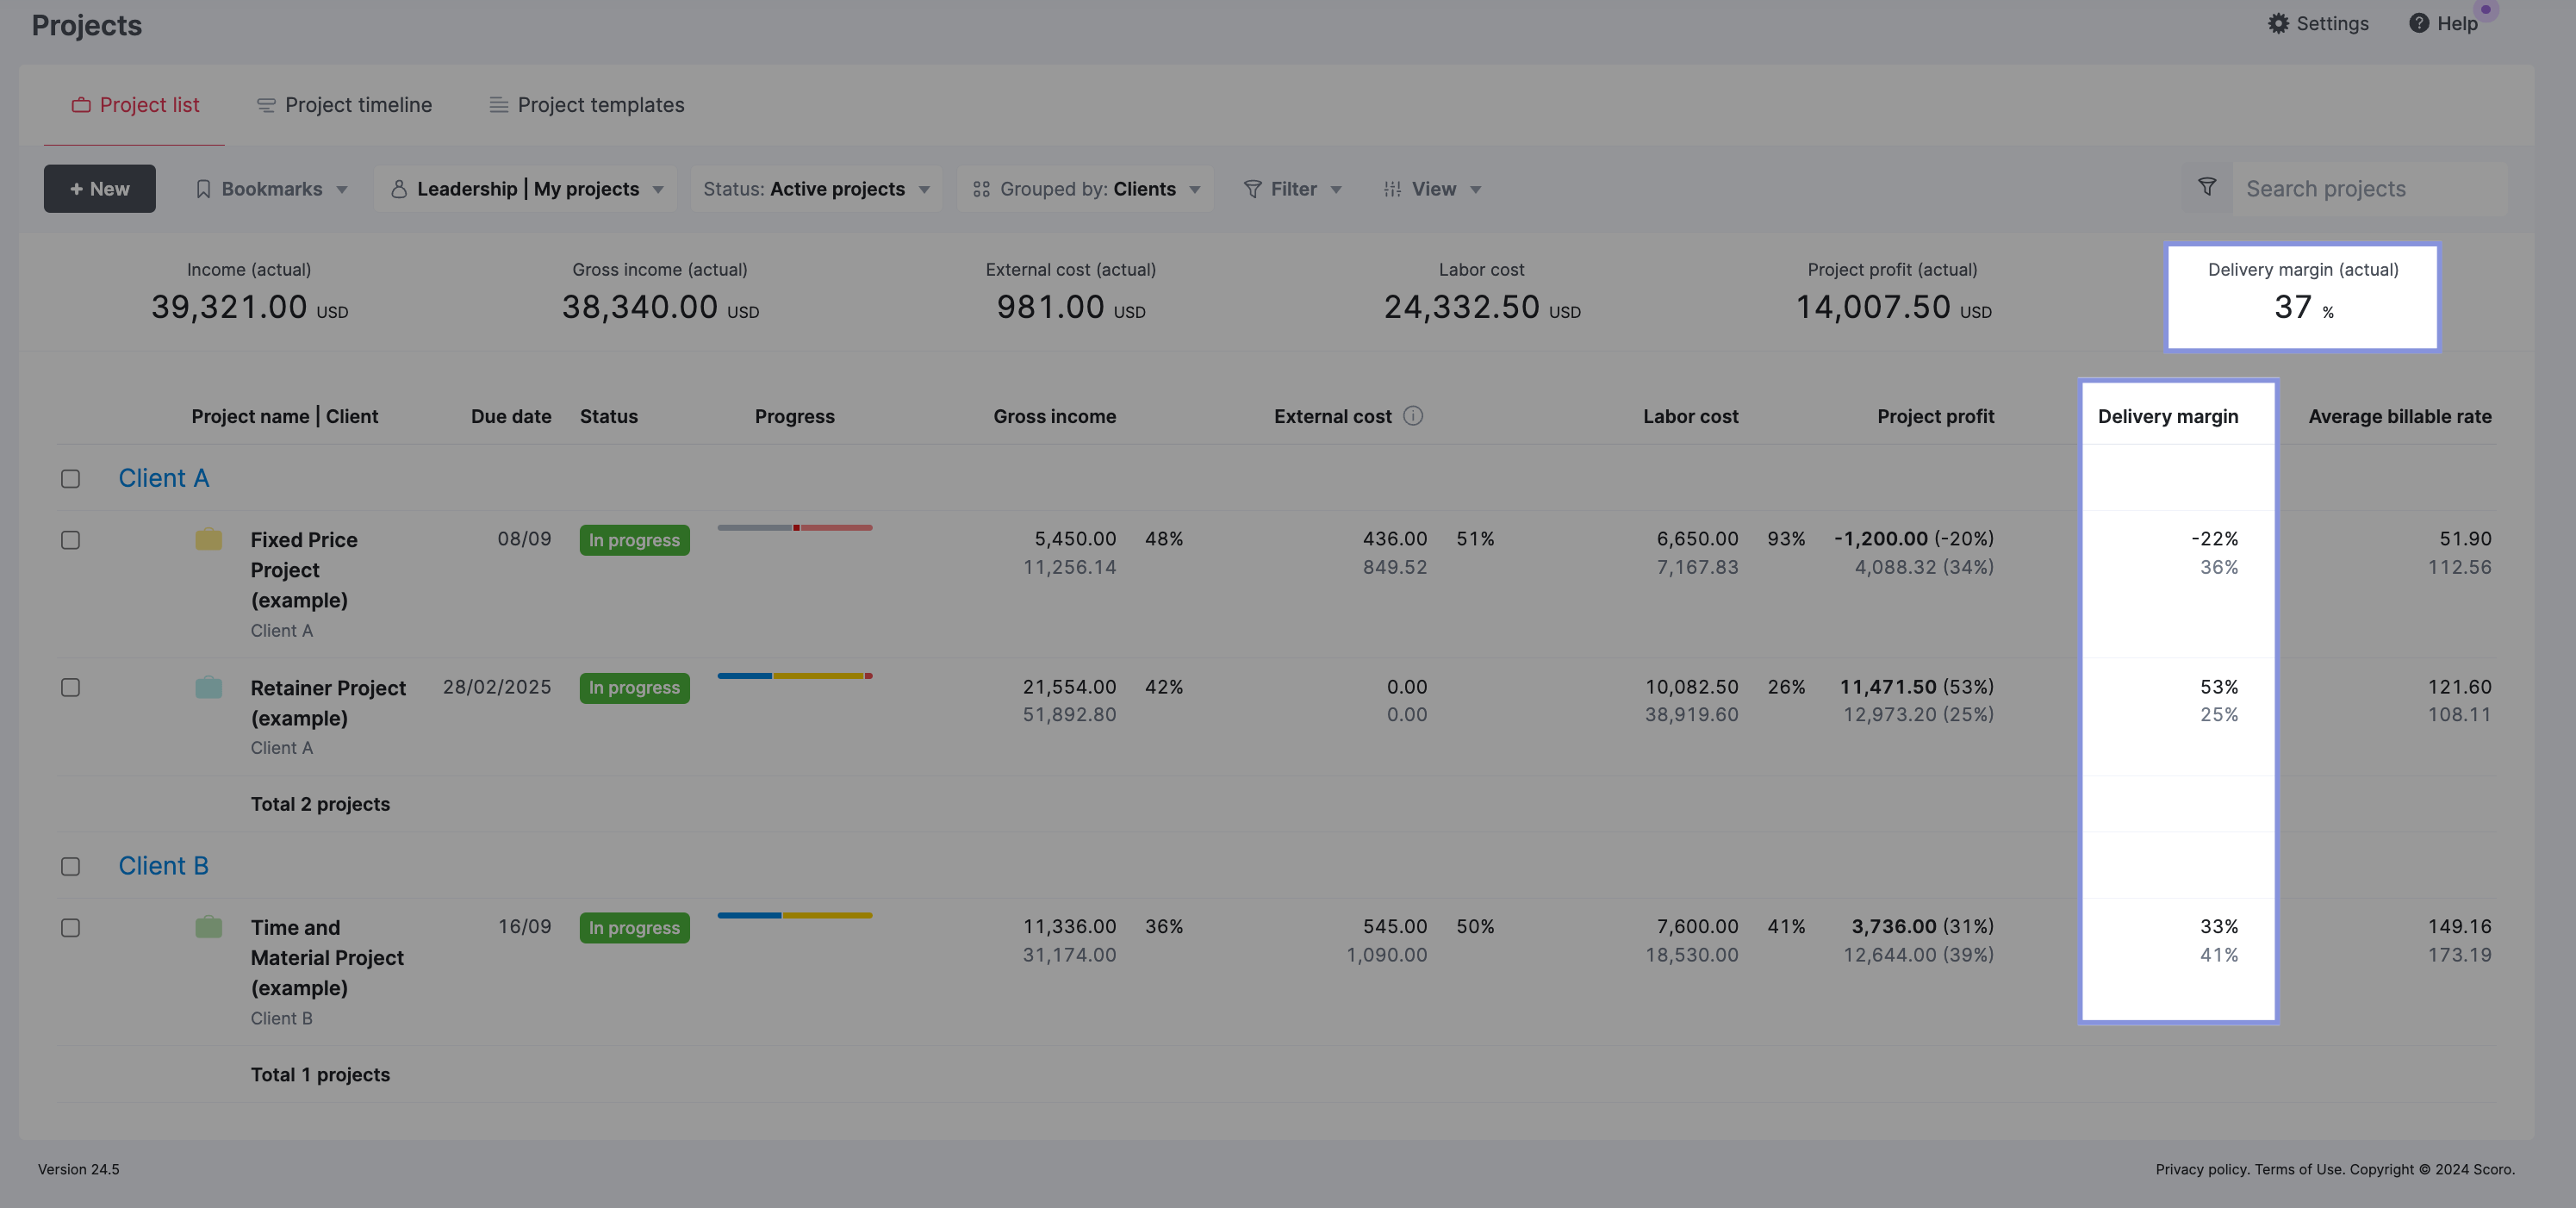
Scoro automates this process. To find your delivery margin in Scoro, return to the “Project list.” view.
To view your project portfolio and individual project delivery margins, check the “Delivery margin” option from both the “Data columns” and “Summary bar” dropdowns
Now, you’ll see the delivery margin automatically calculated in total (via the “Summary bar” at the top) and broken down by project with actual vs. estimated numbers (in the Project list below).
5. Average billable rate
Average billable rate is the hourly rate your agency charges clients for work directly related to their projects. It clearly shows your agency’s average hourly earnings for billable work.
To calculate your average billable rate, divide your total billable revenue by the total hours worked.
Average Billable Rate = Total Billable Revenue / Total Billable Hours
For example, if your agency billed $100,000 for 800 hours of work across all projects in a month, your average billable rate would be:
$100,000 / 800 hours = $125 per hour
Knowing your average billable rate is crucial because it directly impacts your agency’s income and bottom line. If your rate is too low, you might not make enough money to cover expenses, pay your team well, and invest in growing your agency.
Again, you can view this from your “Project list” in Scoro.
Make sure the “Average billable rate (actual)” is checked in the “Summary bar” dropdown and the “Average billable rate” is checked in the “Data columns” dropdown.
You’ll see these metrics automatically calculated for you in total (via the “Summary bar” at the top) and per project.
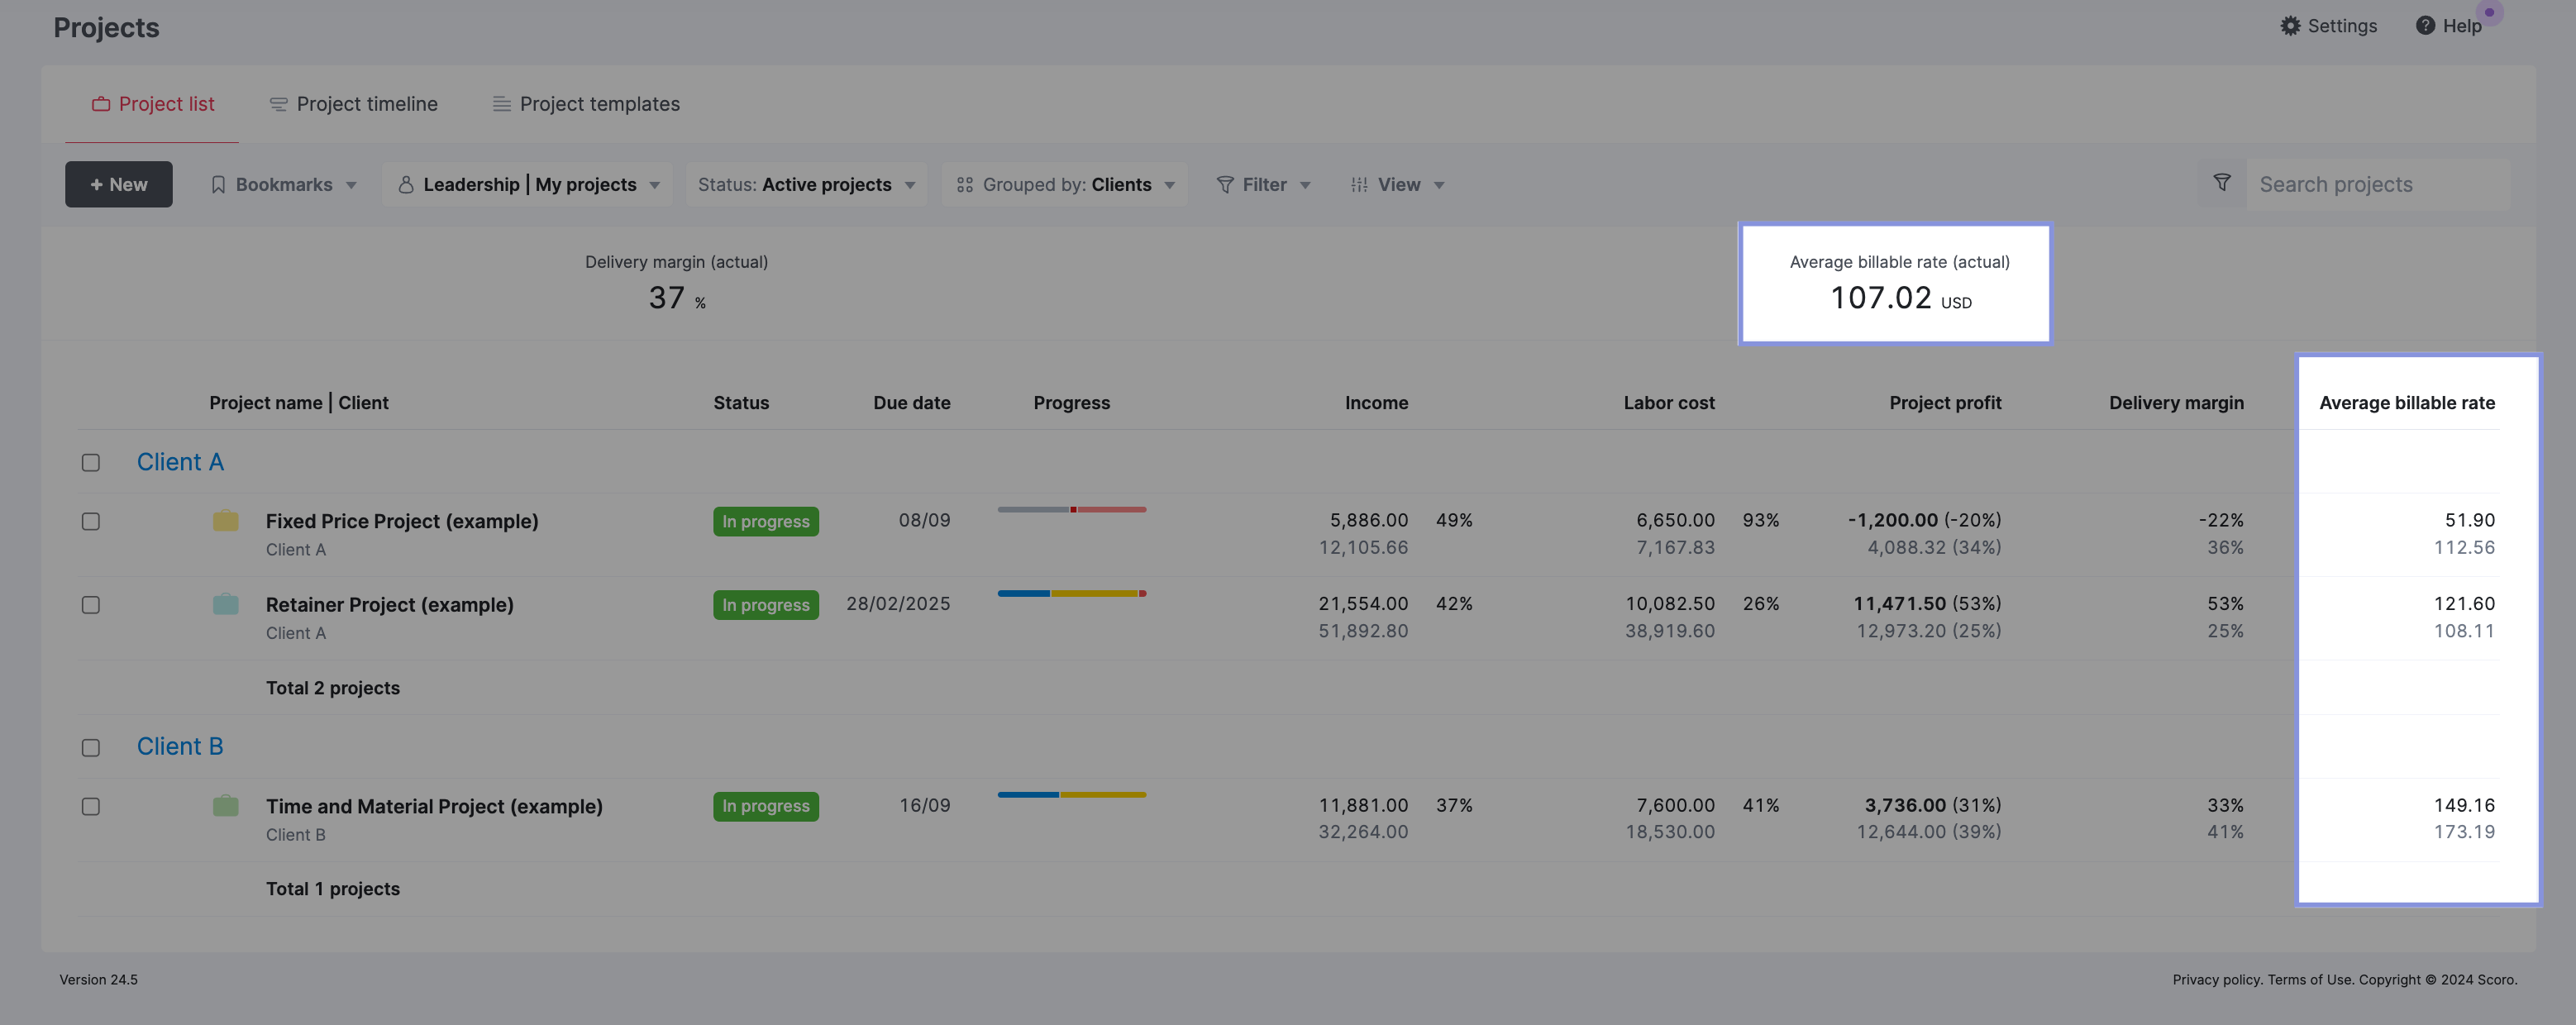
In the above example, the overall “Average billable rate (actual)” of 107.02 USD, as shown at the top, looks reasonable when considering all the projects together.
However, when looking at the individual project details, the “Fixed Price Project (example)” under Client A has a surprisingly low “Average billable rate” of only 51.90 USD per hour.
Armed with this information, you can make more informed decisions about which types of projects to pursue to maintain and improve profitability.
6. Overdue invoices
Overdue invoices are the total amount owed that hasn’t yet been paid.
You can’t pay your bills, employees, or other expenses without a steady cash flow. No matter how profitable your projects are or how healthy your pipeline is, you won’t be able to survive long without incoming cash.
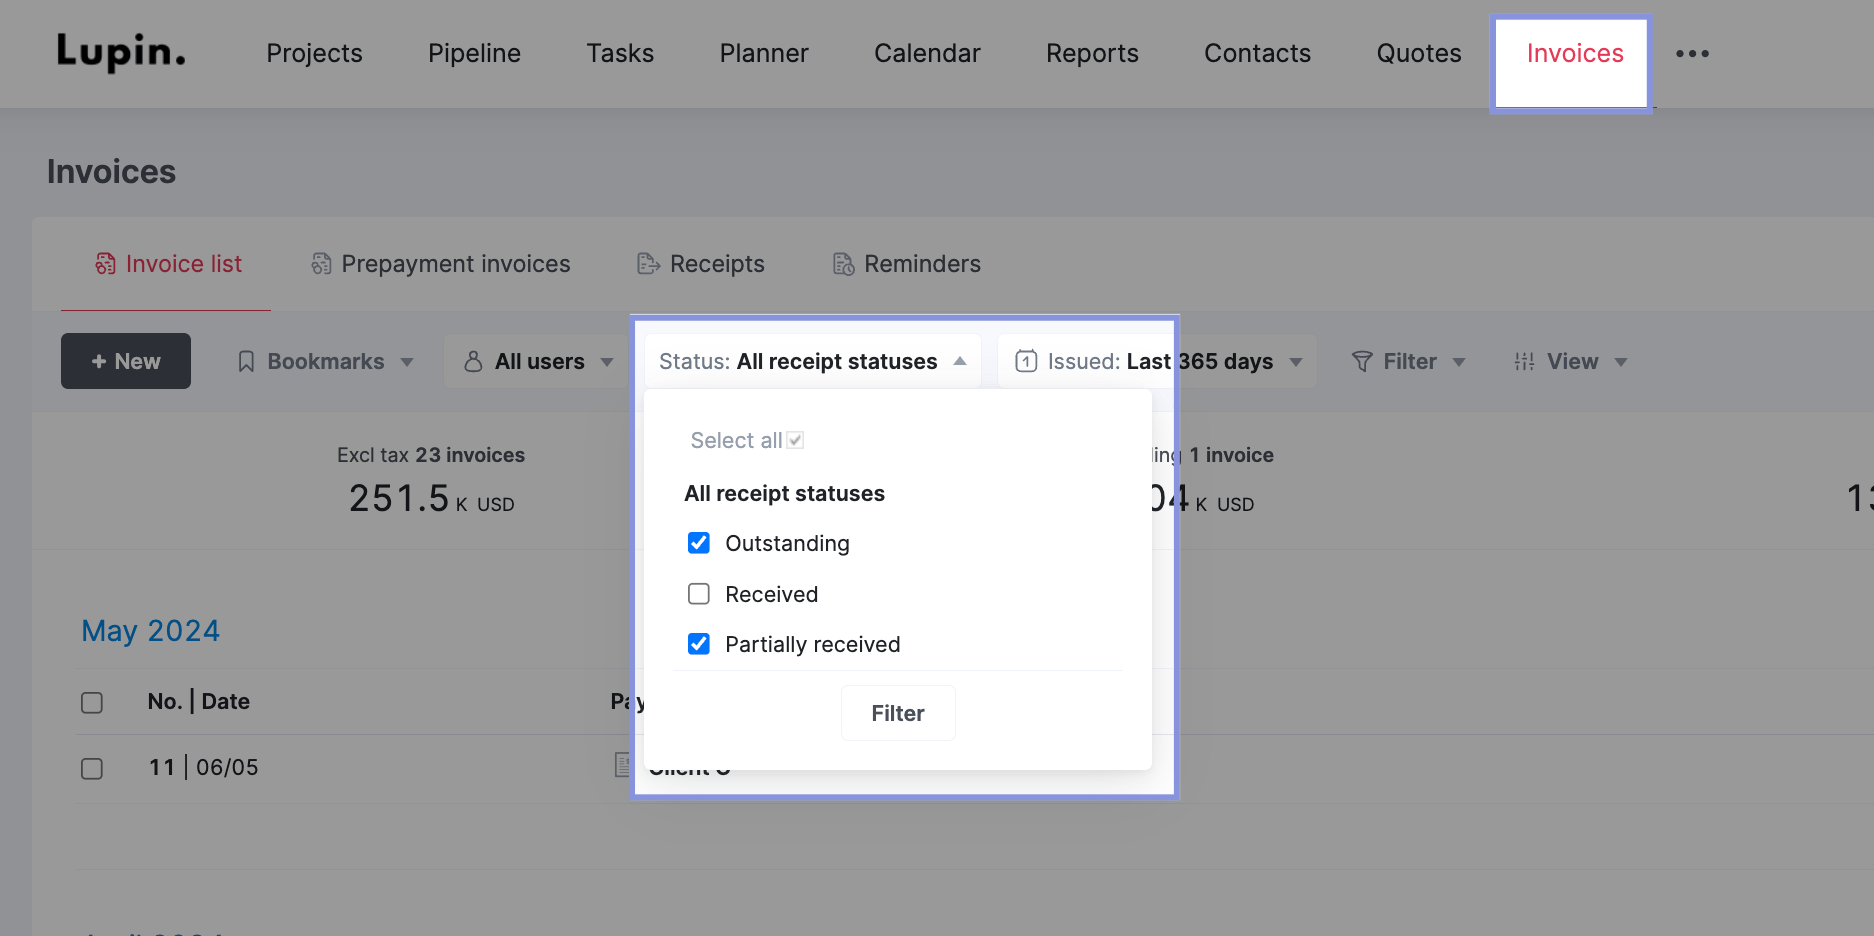
In Scoro, keeping an eye on your overdue invoices is super easy.
Go to the “Invoices” module and then the “Invoice list” view. From here, use the “Status” dropdown filter and select “Outstanding” and “Partially received” invoices.
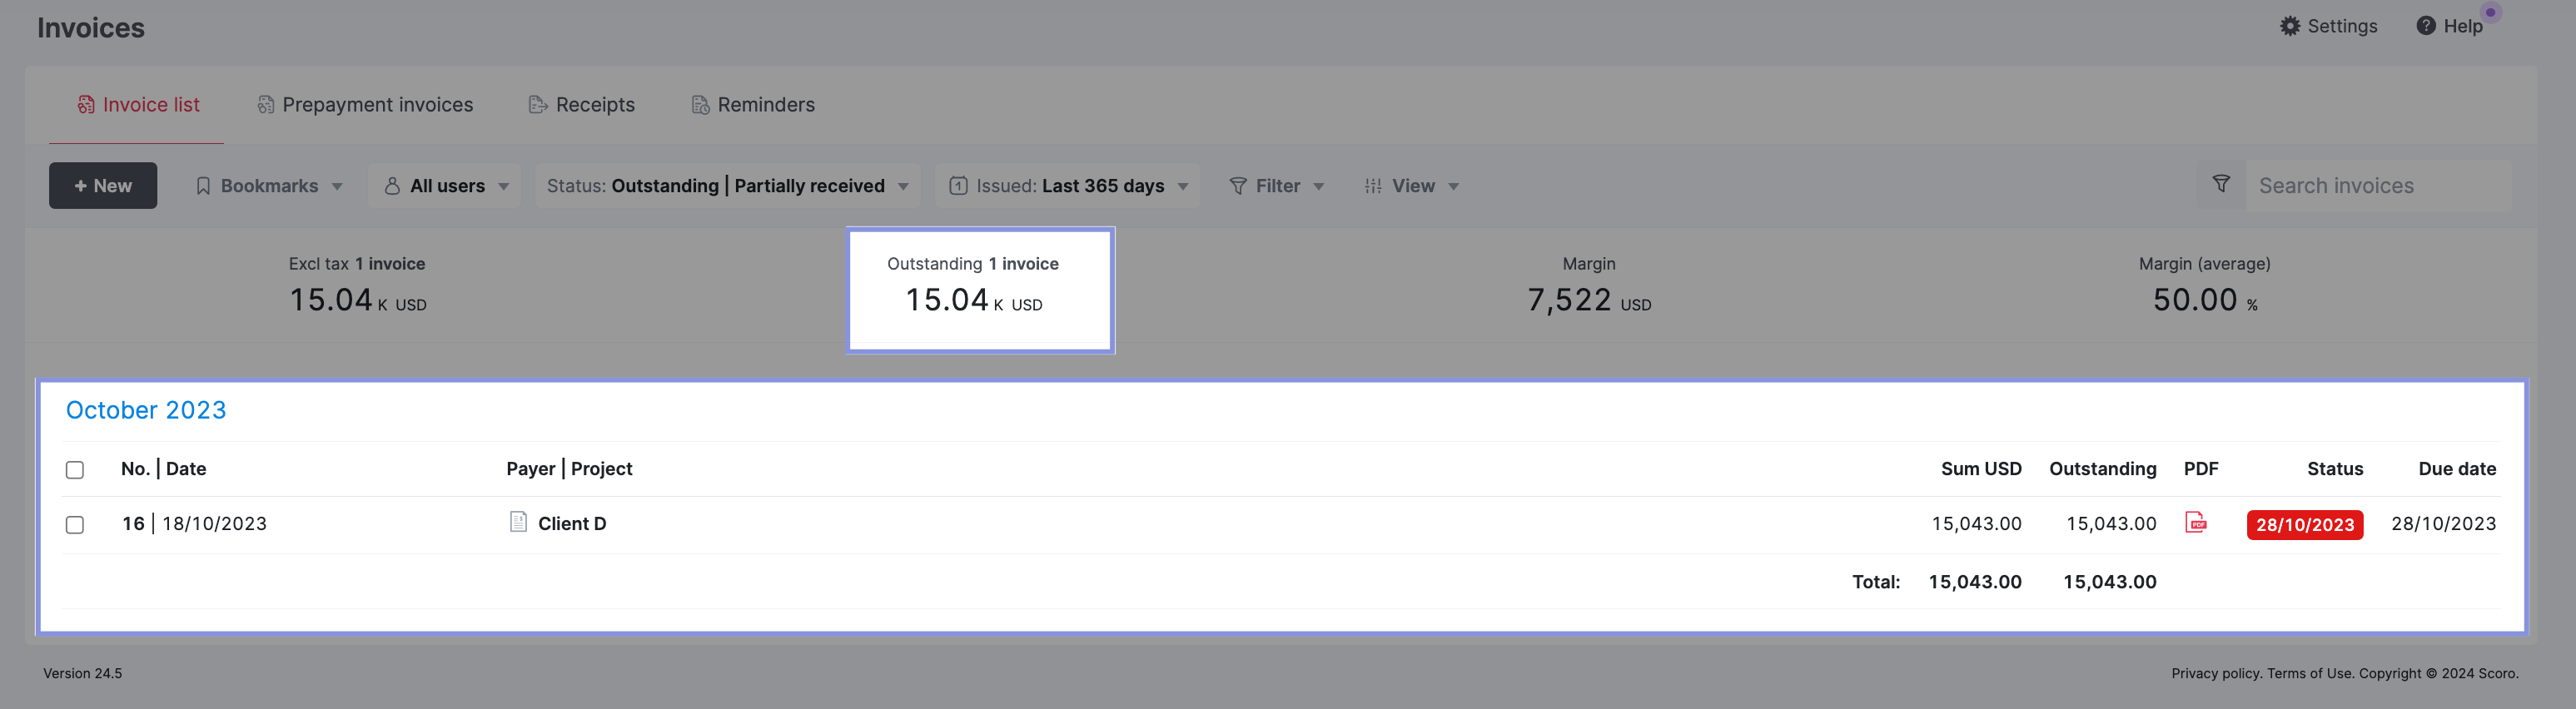
Then, use the “View” dropdown and ensure that “Outstanding sum” and “Overdue sum” are checked in both the “Data columns” and “Summary bar” dropdown.
You’ll see a list of outstanding invoices or payments in the “Summary bar” and table below.
7. Forecasted revenue
Forecasted revenue is the amount of (recognizable) revenue you expect to earn over the coming months.
Recognizable revenue refers to the value of revenue based on the amount of work done, not the total project or engagement value.
For example, you’ve signed and kicked off a $200,000 project, invoiced upfront for $25,000, and held a kickoff meeting.
Does that mean you’ve done $25,000 worth of work so far on the project?
Of course not.
So, your recognizable revenue here isn’t $25,000. Instead, it’s probably more like $250, the billable amount allotted for a kickoff call.
Revenue forecasting ensures that your team is on track to hit targets and profit margins while allowing you to change strategies or tactics to improve revenue and profit targets in the future.
Analyzing revenue forecasts manually can be challenging, so we’ll show you how to do it simply in Scoro.
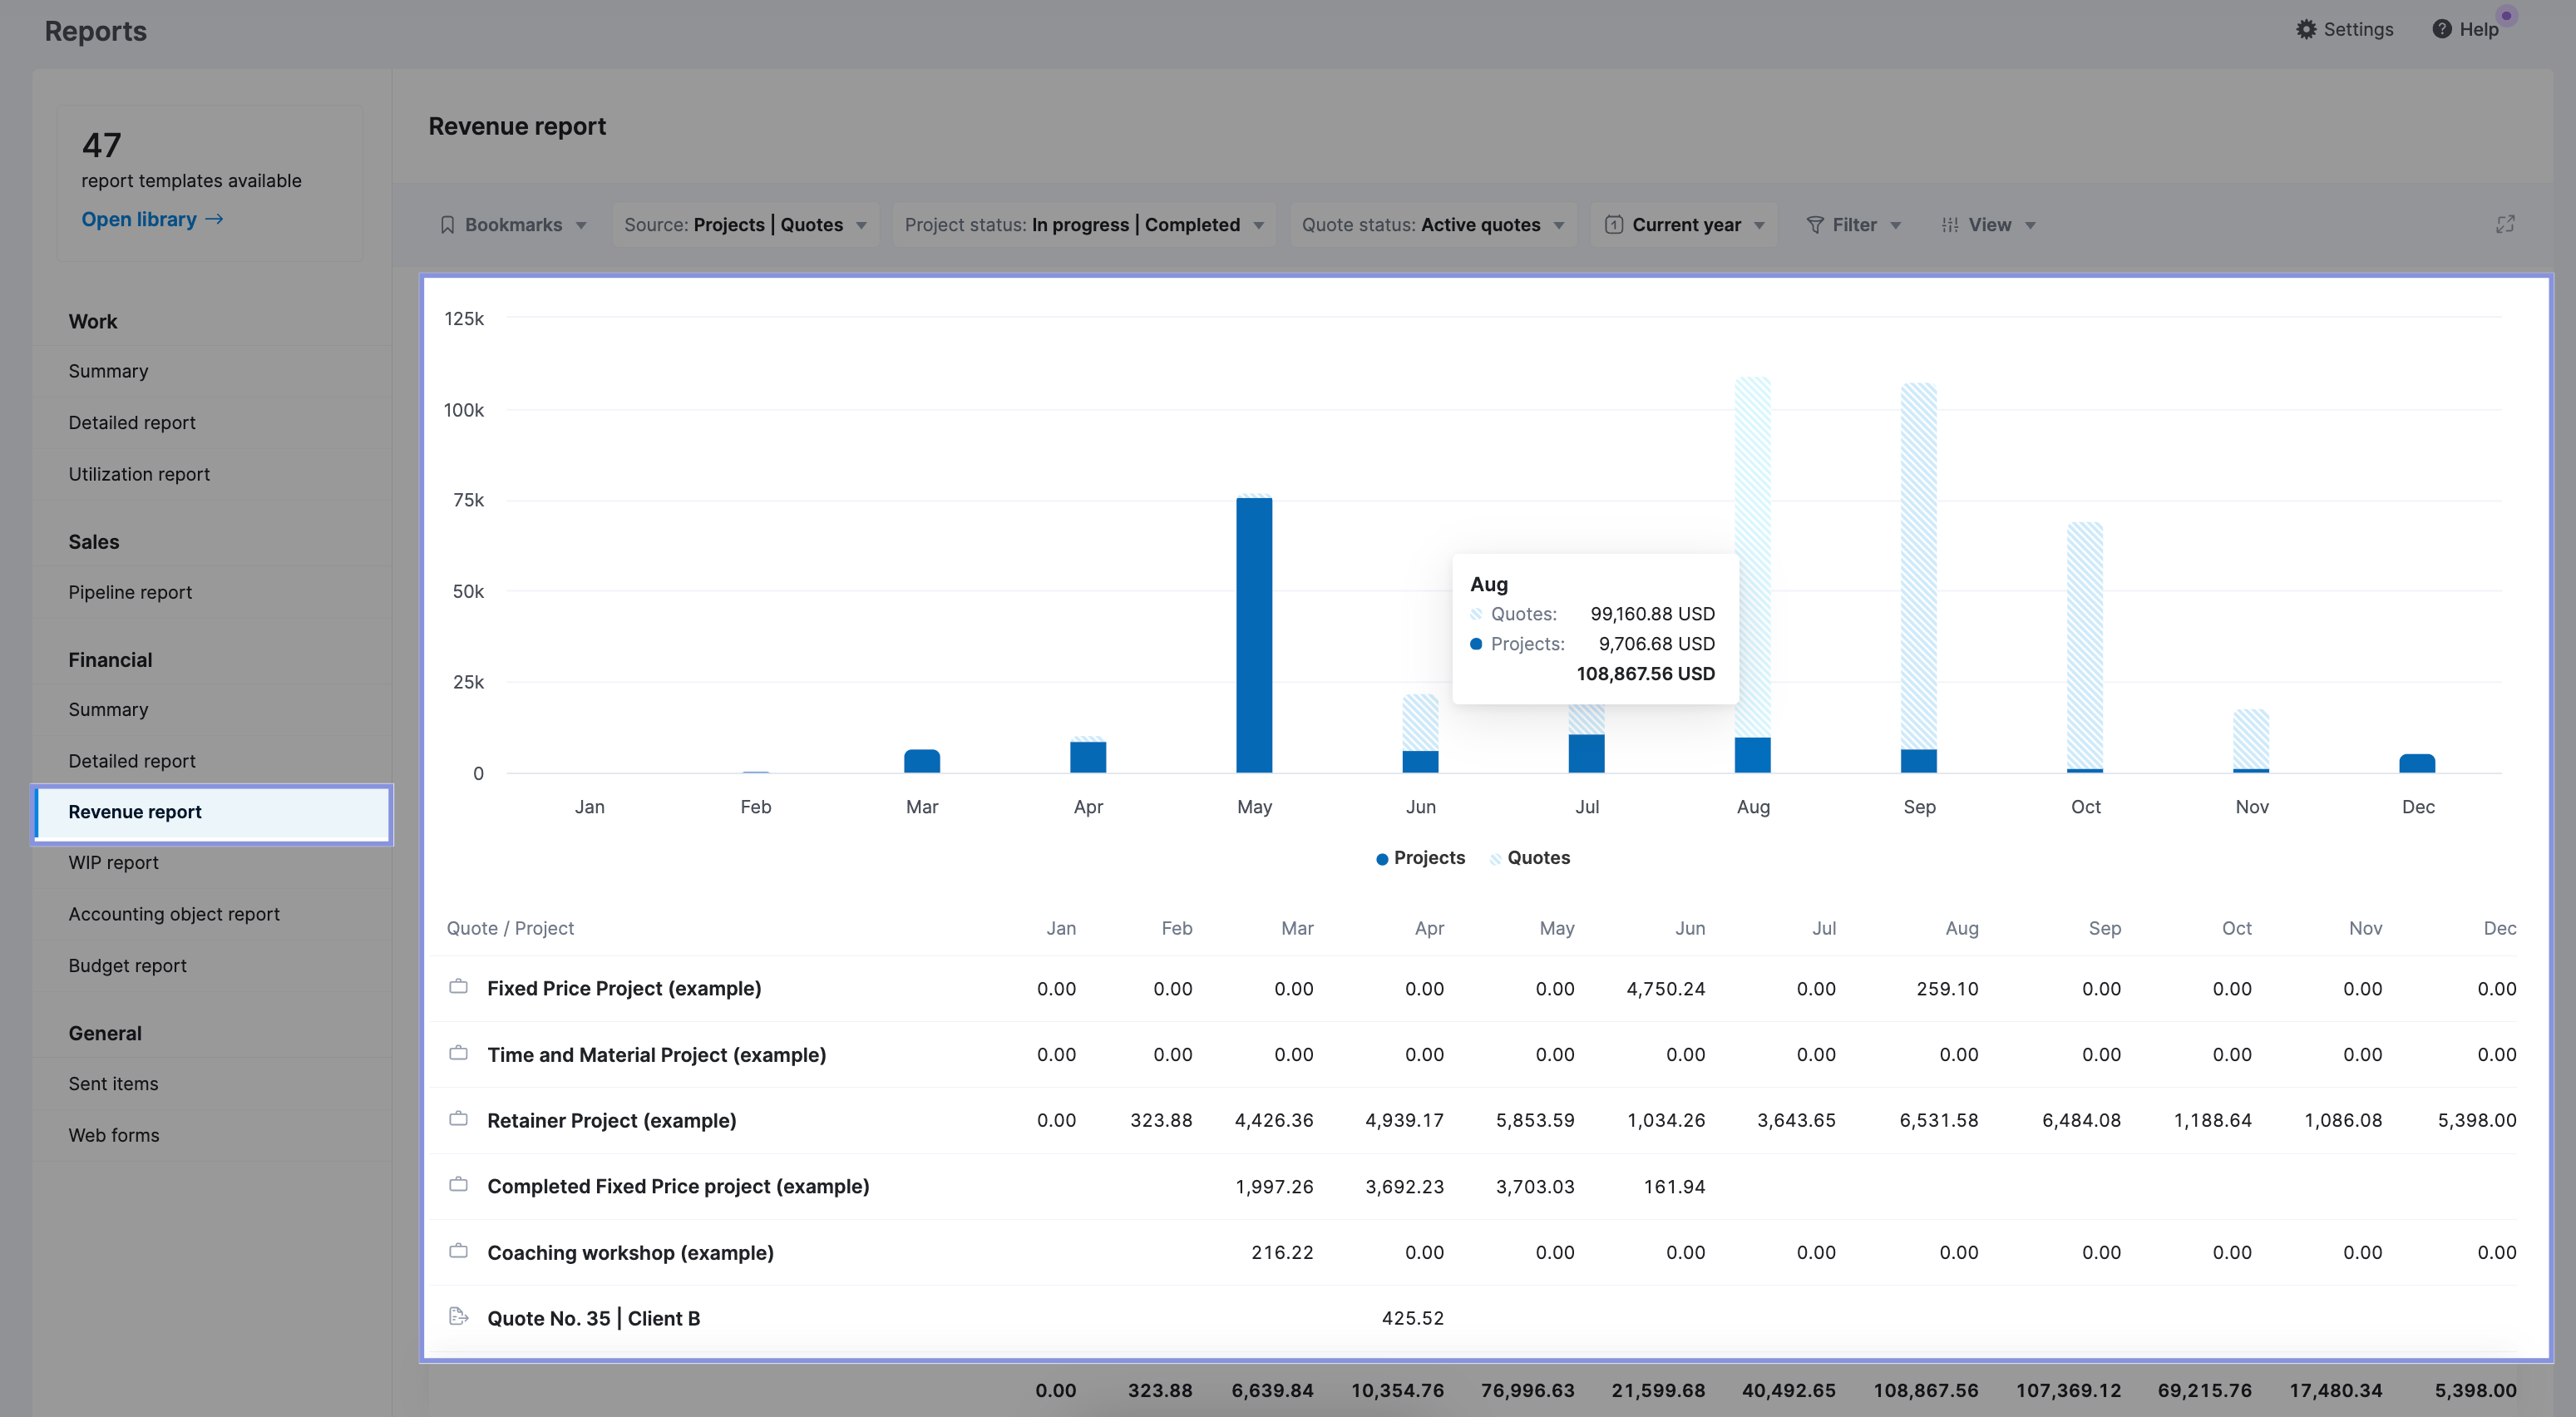
To see the overall revenue forecast for your company, look at the “Revenue” report, which combines information from two places:
- Quoted projects you haven’t started yet. These are potential future revenue opportunities.
- Ongoing projects you are currently working on. This is revenue you are actively earning by delivering services.
Further Reading: Revenue Recognition and Forecasting in Scoro
Operational metrics
Operational metrics help you monitor your team and how effectively you use each member. Here are the key ones to track for increased profitability.
8. Team utilization %
Team utilization percentage is a backward-looking metric showing the percentage of an employee’s total capacity spent working.
It can be calculated using the following formula:
Utilization % = [total tracked hours] / [total capacity]
Where:
- Total Tracked Hours = The total number of hours logged/recorded by your team members for billable project work
- Total Capacity = The total number of available working hours
For example, most of your team members may have 40 hours of capacity each week. In the last week, a team member who logged 32 hours was 80% utilized. However, another team member may have tracked 38 hours, which means they were 95% utilized.
Understanding your team’s utilization percentage gives you a clear picture of team efficiency and productivity. If you can improve your utilization percentage, you can often improve delivery margin and profitability, so analyzing your utilization is crucial.
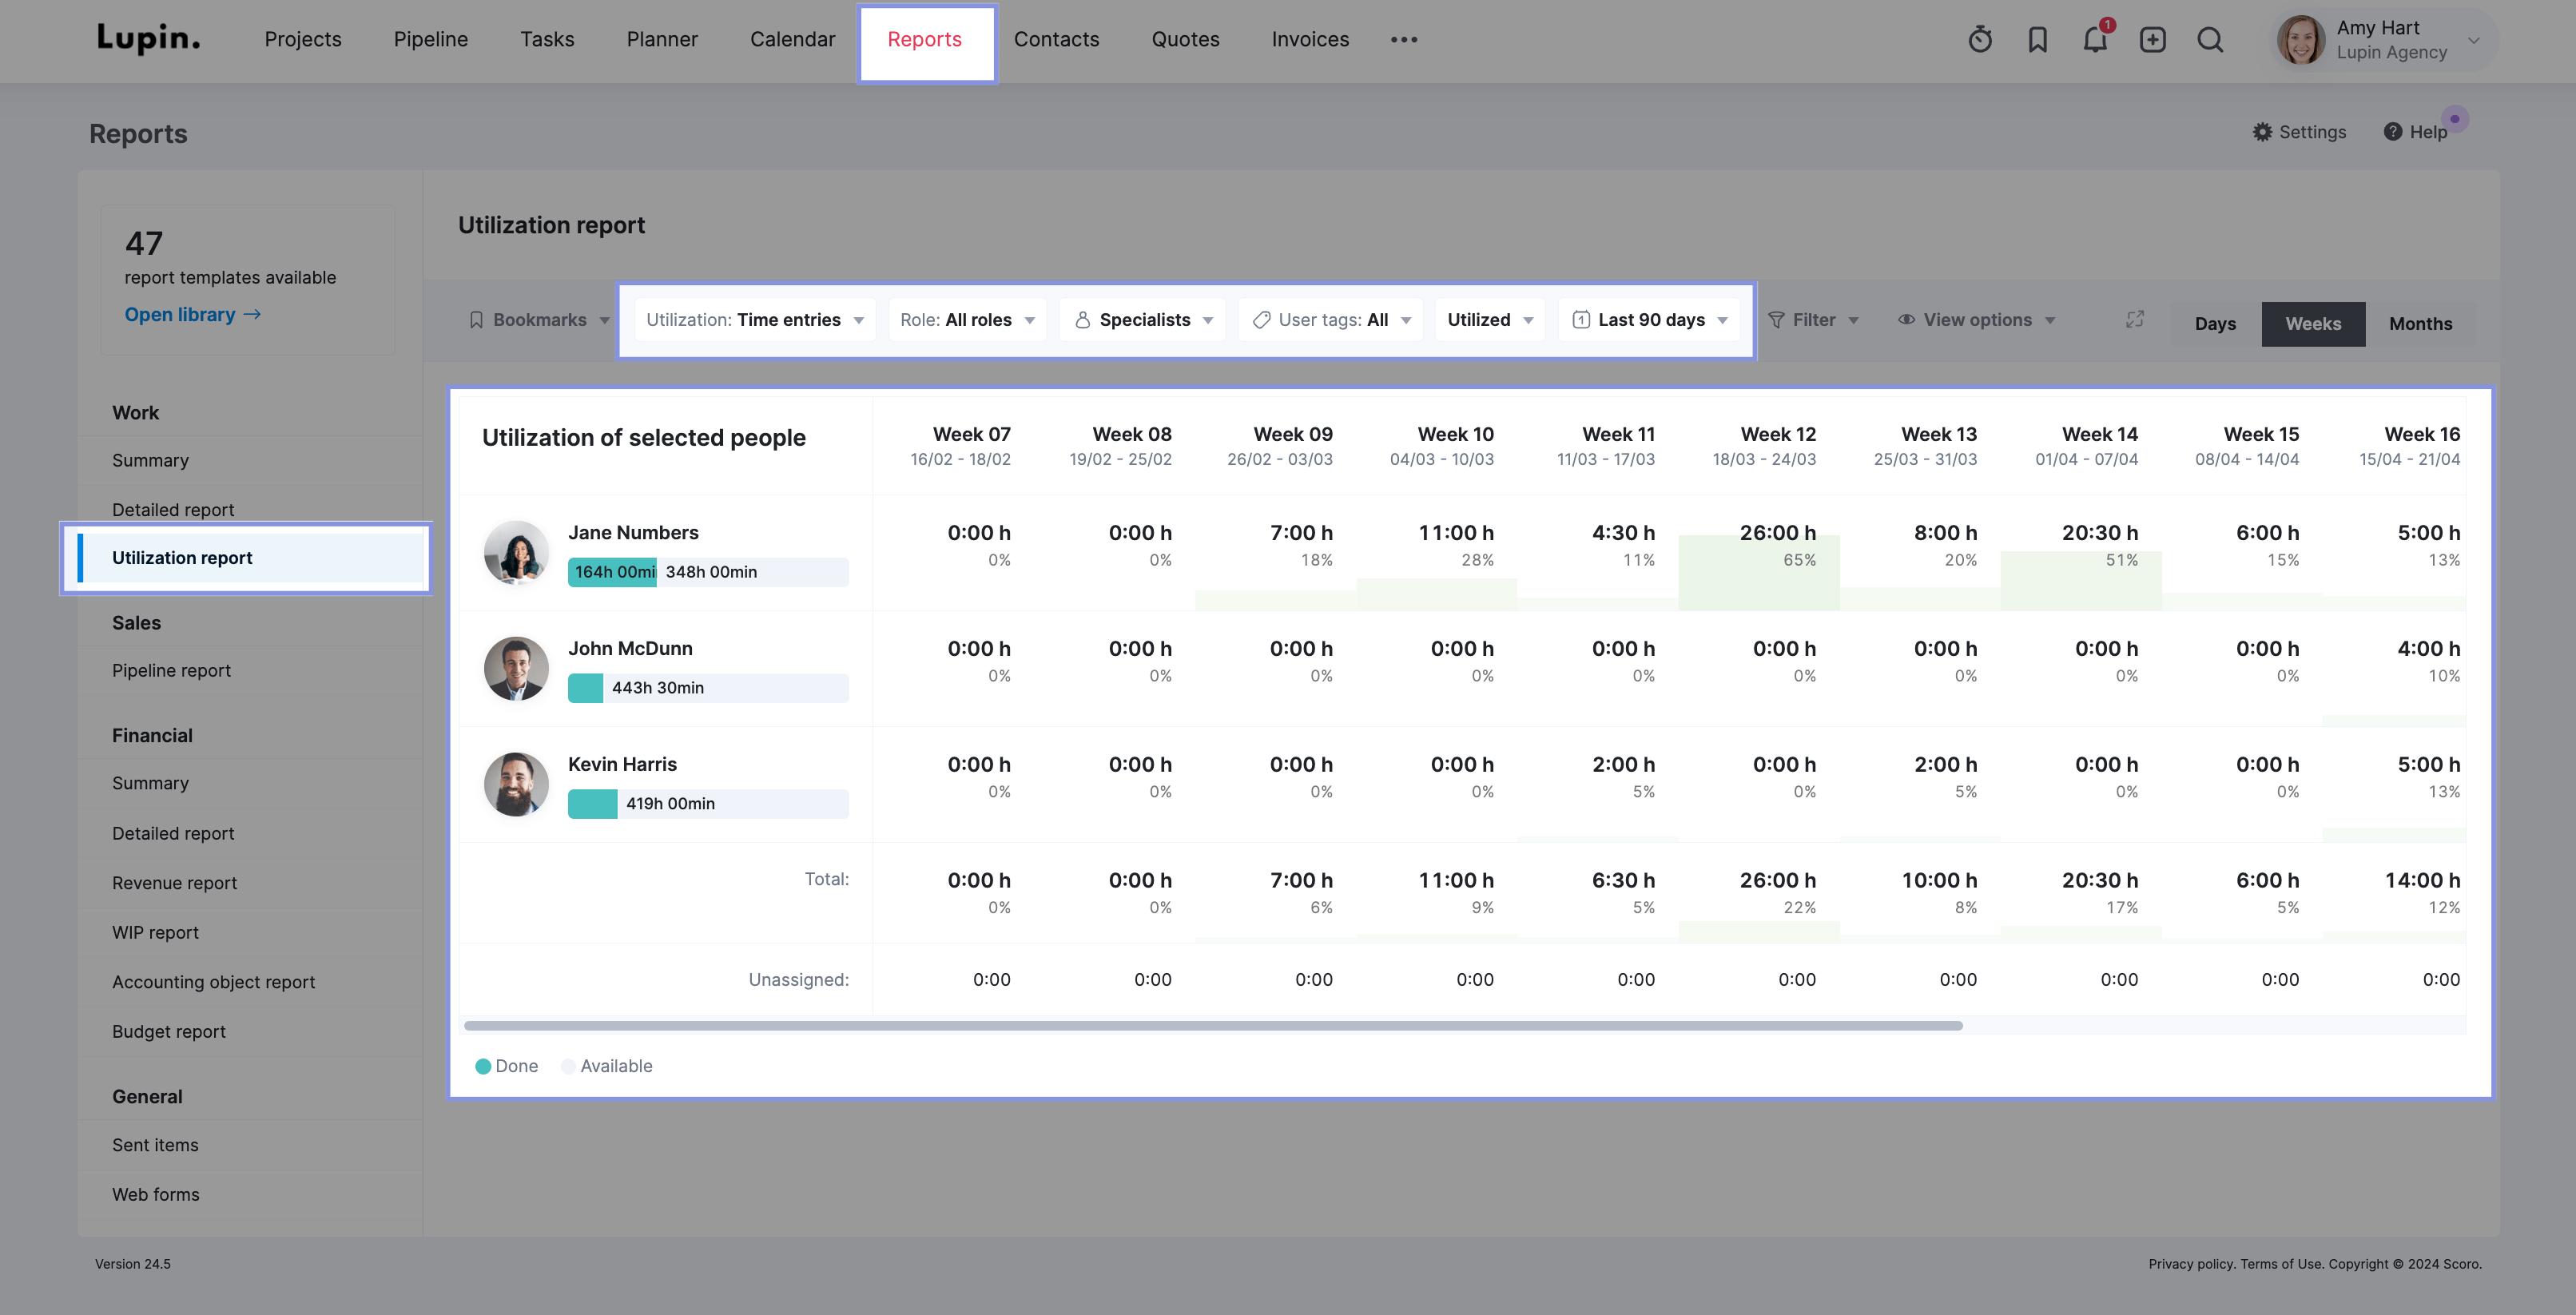
You can view team utilization from the “Utilization report” in Scoro.
To view utilization percentages, use the time filter to sort by “Last 90 days.” Each team member’s utilization percentage is automatically calculated based on tracked time.
9. Utilization forecast
Utilization forecast shows you how available vs. booked your team is in the future, expressed as a percentage.
Utilization forecast can be calculated with the following formula:
[total booked hours] / [total capacity] = utilization percentage
Where:
- Total Booked Hours = the number of hours/tasks your team is already booked or scheduled to work on
- Total Capacity = The total number of available working hours
For example, if a team member has 40 available hours each week for their capacity, and in the upcoming week, they have 20 hours already of scheduled work, then you can see that they’re currently 50% utilized. They already have 50% of their time booked and 50% available for work.
You can calculate utilization forecasts for individual team members and your team. Tracking your team’s utilization will help you see who can take on more projects, who’s overworked, and how productive your team is.
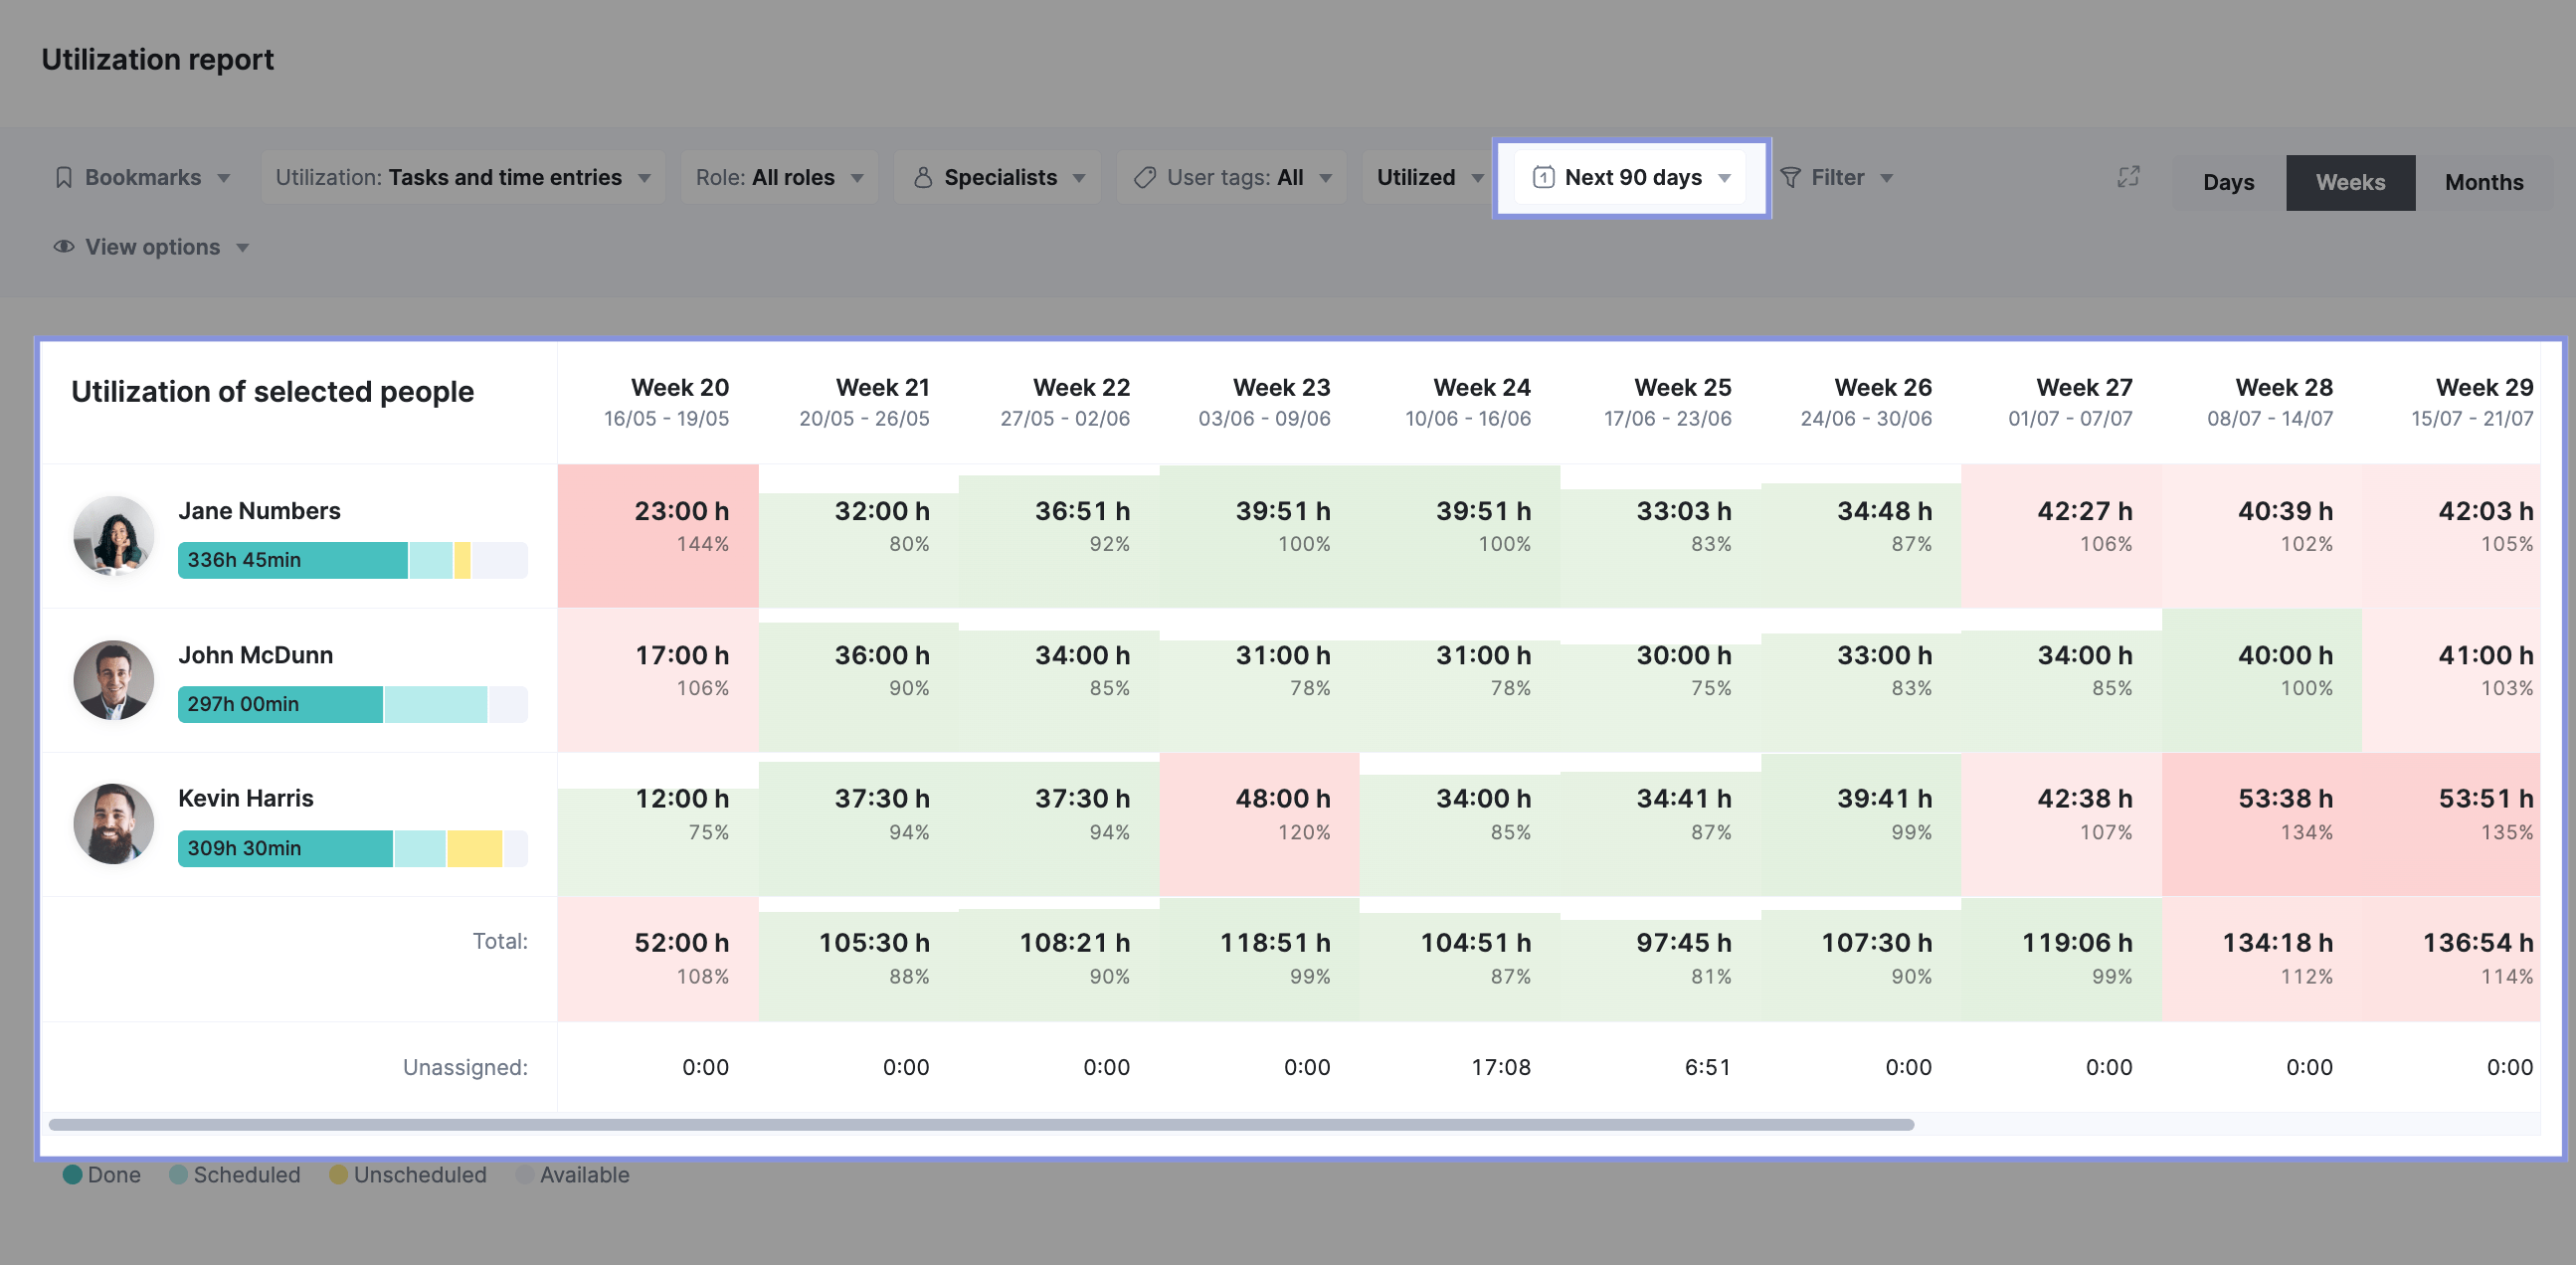
Scoro shows you your utilization forecast via the same “Utilization report.”
You can use the date filters in this report to examine future utilization. For example, select “Next 90 days” to see forecasted utilization over the coming three months.
This green bar shows how each employee is utilized by week, their total booked hours, and their percentage utilization.
If an employee is forecast to be overutilized (>100%) for a future week, the status bar will turn red. This red overutilization indicator allows you to quickly identify employees who may be overbooked and reassign work as needed to rebalance utilization.
10. Time usage by projects
Time usage by project measures how much time your team has spent working on each individual project over a given period.
Understanding your time usage by project lets you quickly see which clients or projects are being neglected or overserviced.
In addition, you can see exactly which project phases or tasks are eating up your team’s time, which allows you to scope future projects more accurately.
Your team will need to track their time and assign it to the corresponding projects to calculate time usage by projects.
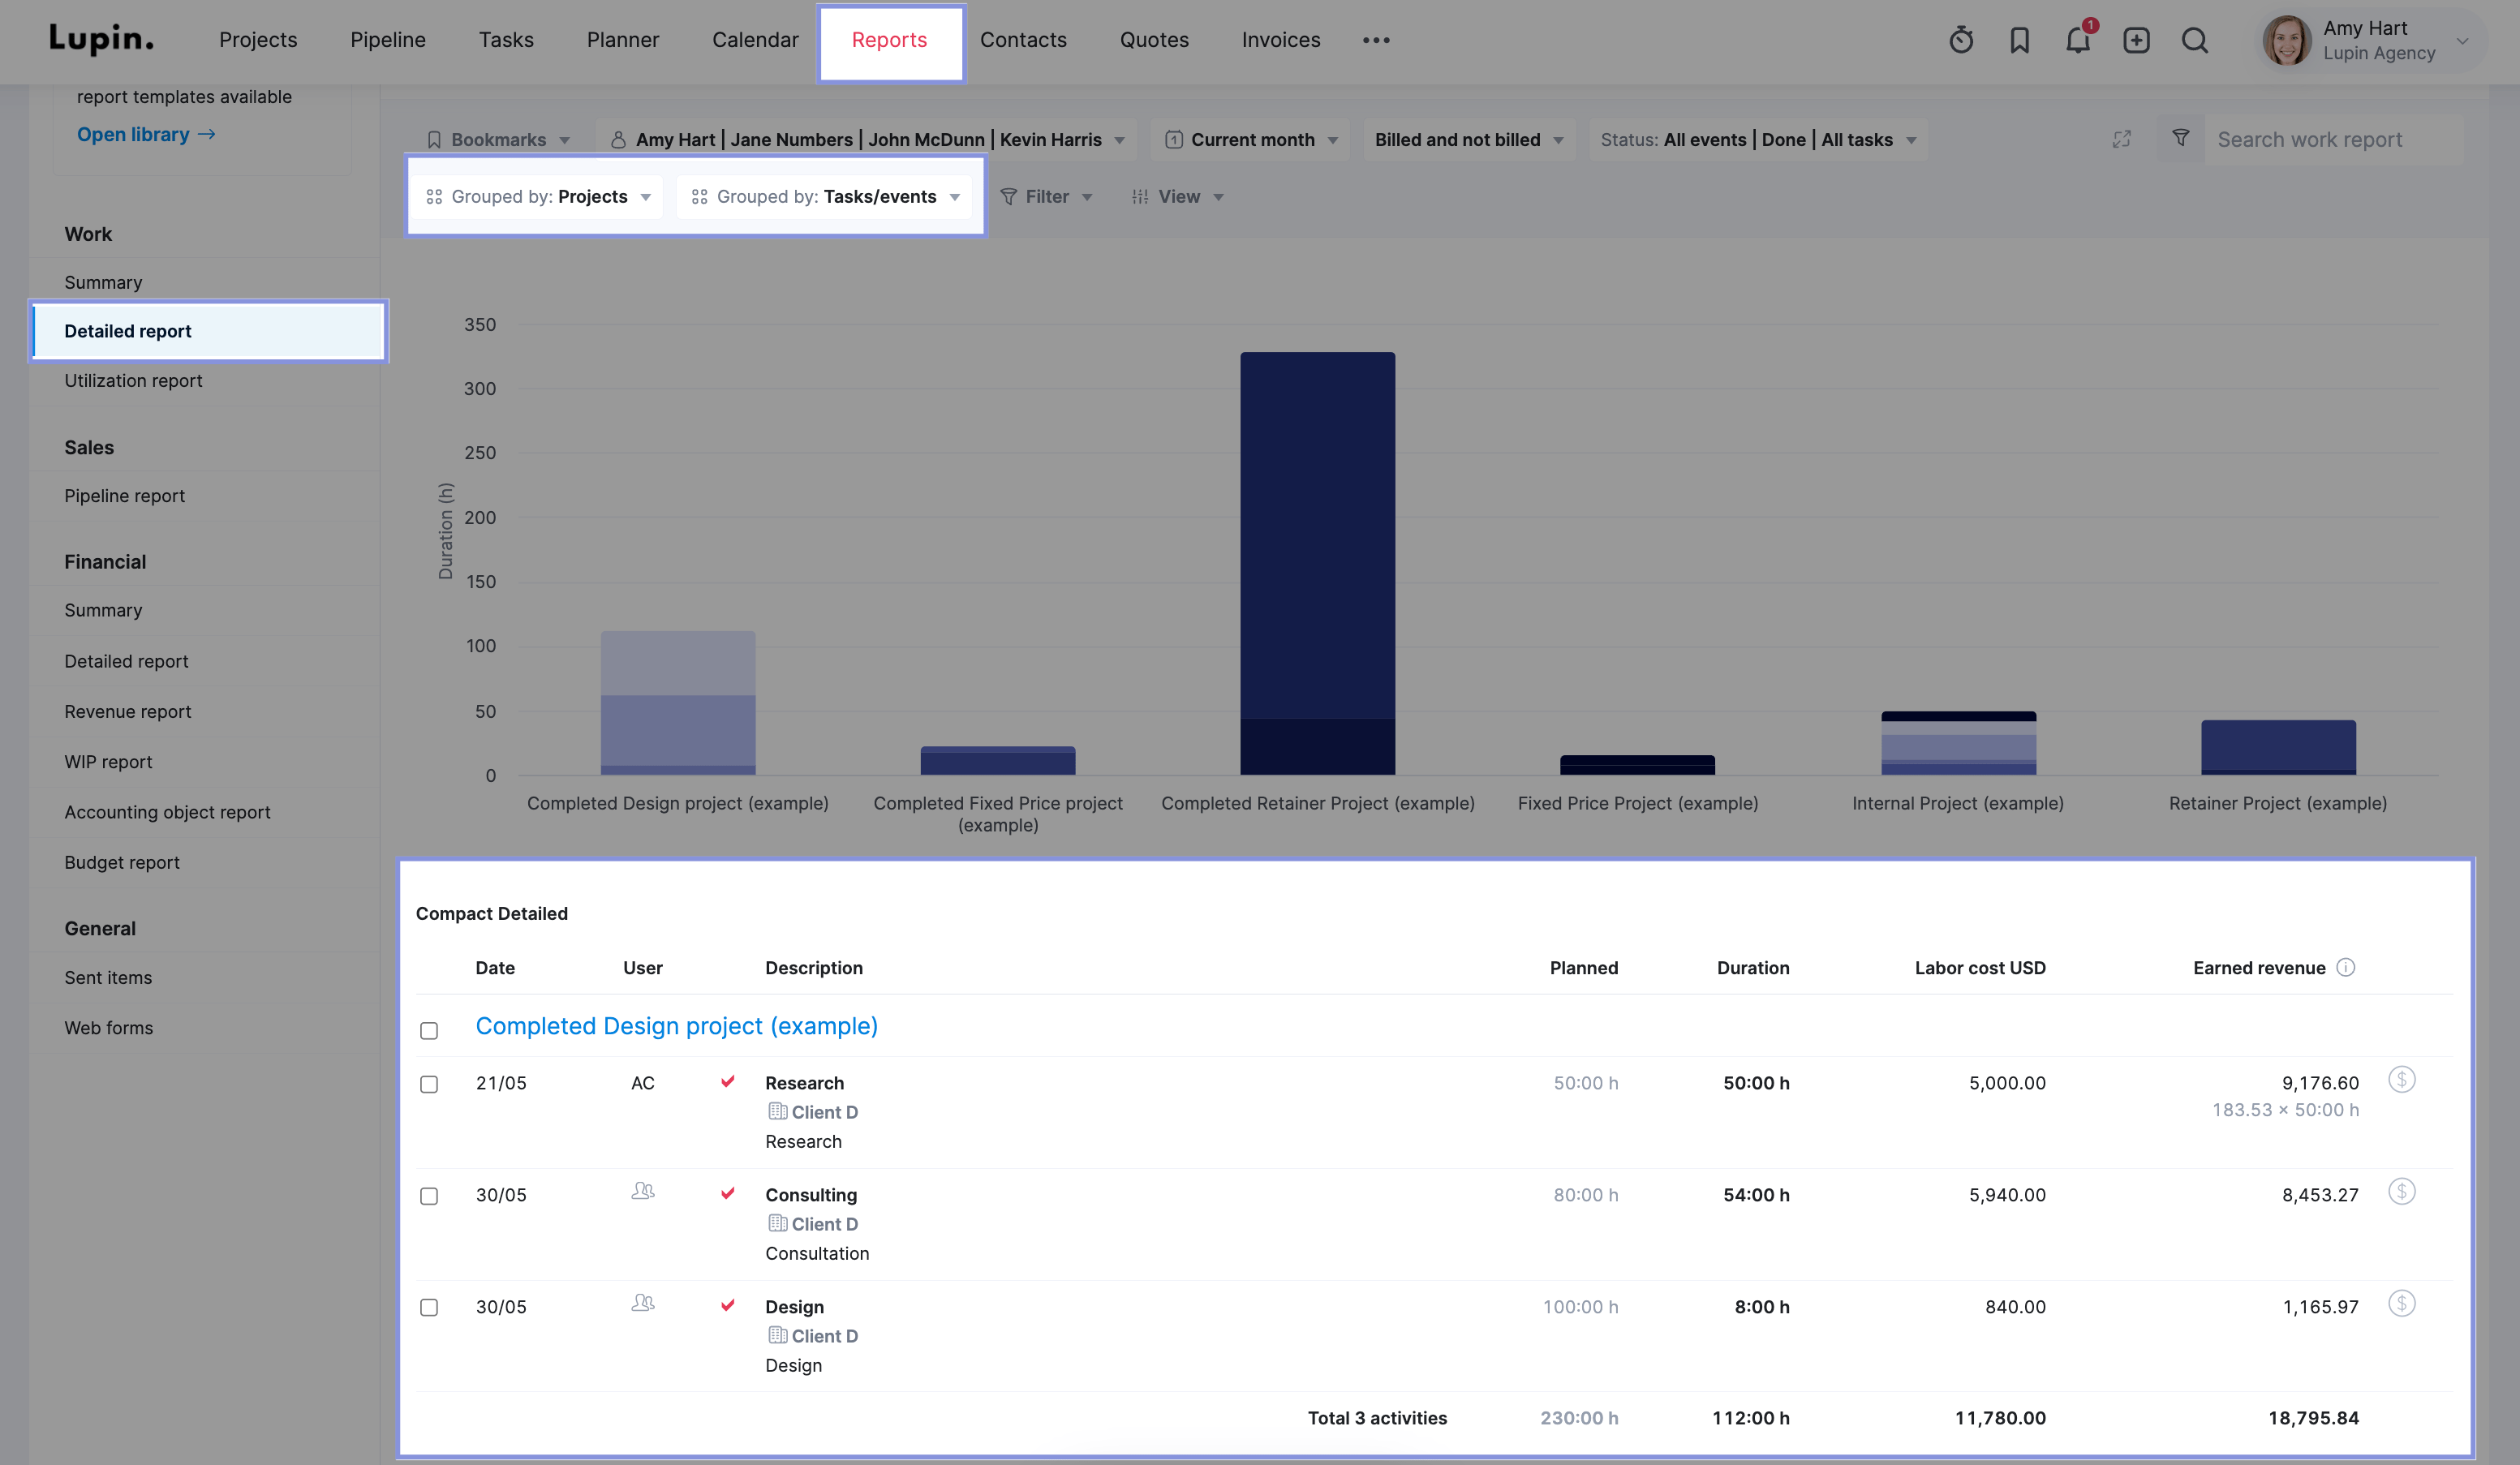
Scoro’s “Detailed” work report compares the estimated time for each project against the actual time your team spent working on it.
To access this report, follow these steps:
- Click on the “Reports” module in Scoro’s main navigation.
- Under the “Work” section, select the “Detailed report“.
- In the first “Grouped by” drop-down menu, choose “Projects“.
- In the second “Grouped by” drop-down menu, select “Tasks/events“.
This will then display a breakdown that shows you the following for each project and its associated tasks/events:
- The estimated number of planned hours for the project and tasks initially
- The actual number of hours your team members logged while working on that project and its tasks

Project management metrics
Project management metrics give you insight into your agency’s efficiency, productivity, and project-level profitability.
11. Project profit
Project profit is the amount your agency earns from a specific project after accounting for all associated costs.
Typical project costs include:
- Labor costs: Your in-house delivery cost is based on the hours logged for each task and project and the employee’s hourly labor rate.
- Pass-through costs: Expenses from third-party suppliers, contractors, products, services, and any reimbursable costs incurred by employees to deliver a project billed directly to the client.
You can use the following formula to calculate project profit:
Project profit = (project revenue) – (pass-through costs) – (labor costs)
If a project has $50,000 in revenue, $10,000 in pass-through costs, and $25,000 in labor costs, then:
Project Profit = $50,000 – $10,000 – $25,000 = $15,000
Understanding project profit highlights which projects are the most profitable for your company, not just those bringing in the most revenue.
Similarly to agency gross income and delivery margin, when looking at project profit, it can be easy to overestimate the value of certain projects without considering the total costs of delivering them.
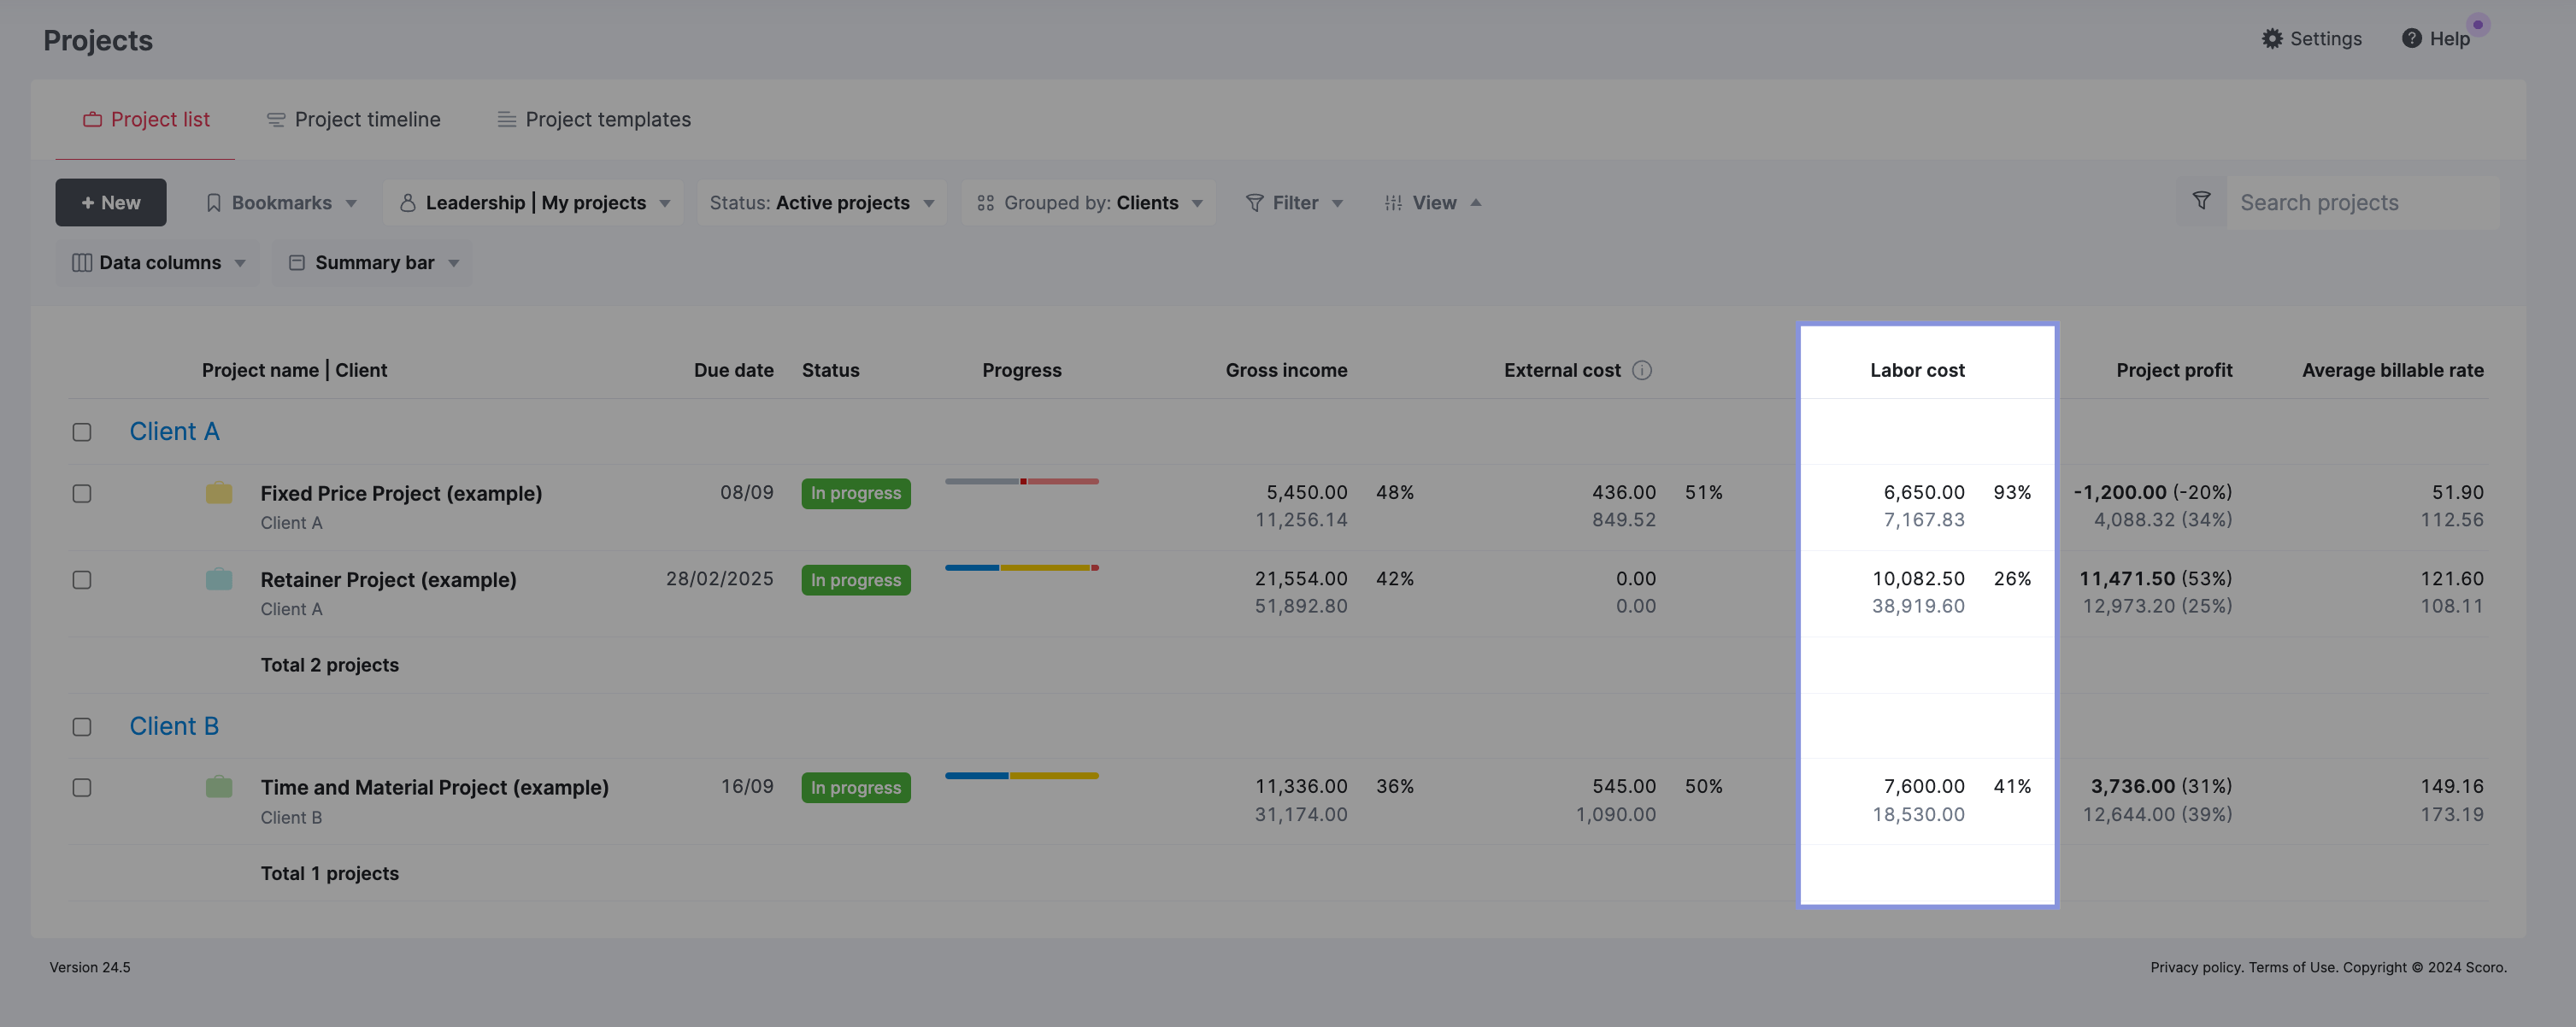
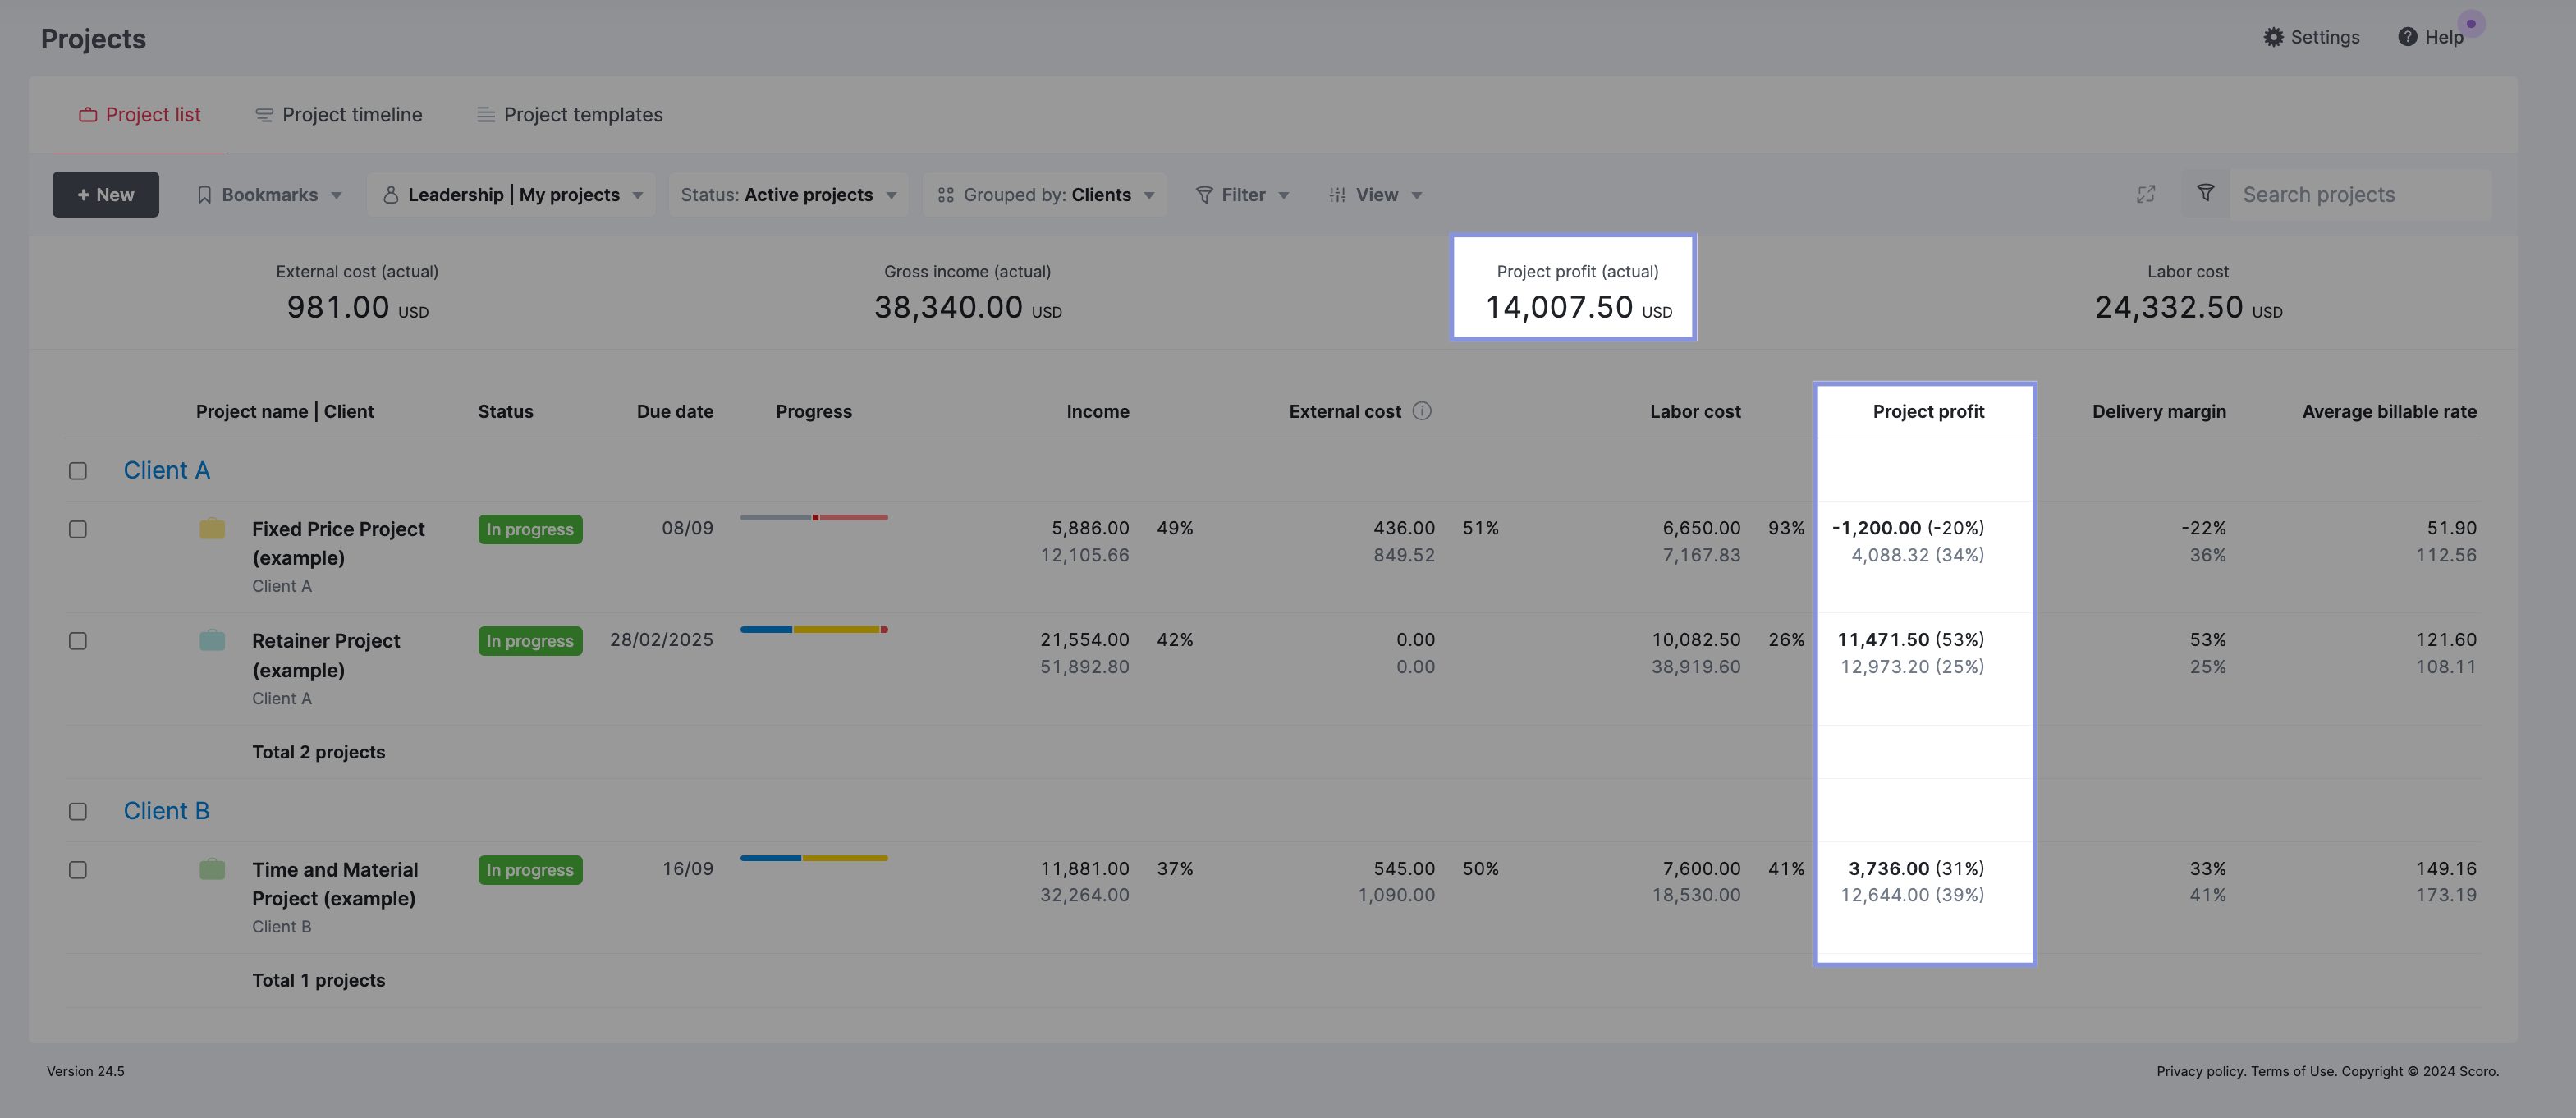
In Scoro, project profit is calculated automatically for you, and you can view it easily from the “Project list.”
Go to “Project list” in the “Projects” module. Then, select selected “Project profit” in the “Summary bar” and “Data columns” dropdowns.
Now, you’ll see a list of all your active projects, the total project profit calculated across all projects (in the summary bar at the top), and per project (in the table view below).
12. Project budget vs. actual costs
Comparing your project budget to actual costs helps you track whether a project is progressing within the planned budget or if costs are exceeding expectations. This comparison is crucial for maintaining healthy profit margins.
Imagine your agency takes on a branding project with a budget of $15,000:
- Estimated labor costs: $10,000
- Estimated pass-through costs: $5,000
During the project, you track the actual costs:
- Actual labor costs: $12,000
- Actual pass-through costs: $4,500
- Total actual costs: $16,500
Comparing the budget to the actual costs:
- Budget: $15,000
- Actual costs: $16,500
- Difference: $1,500 over budget
The project exceeded budget by $1,500 due to additional labor hours required. Not ideal.
If your projects consistently exceed budget, you may need to reevaluate pricing, time estimates, or scope to maintain healthy profit margins.
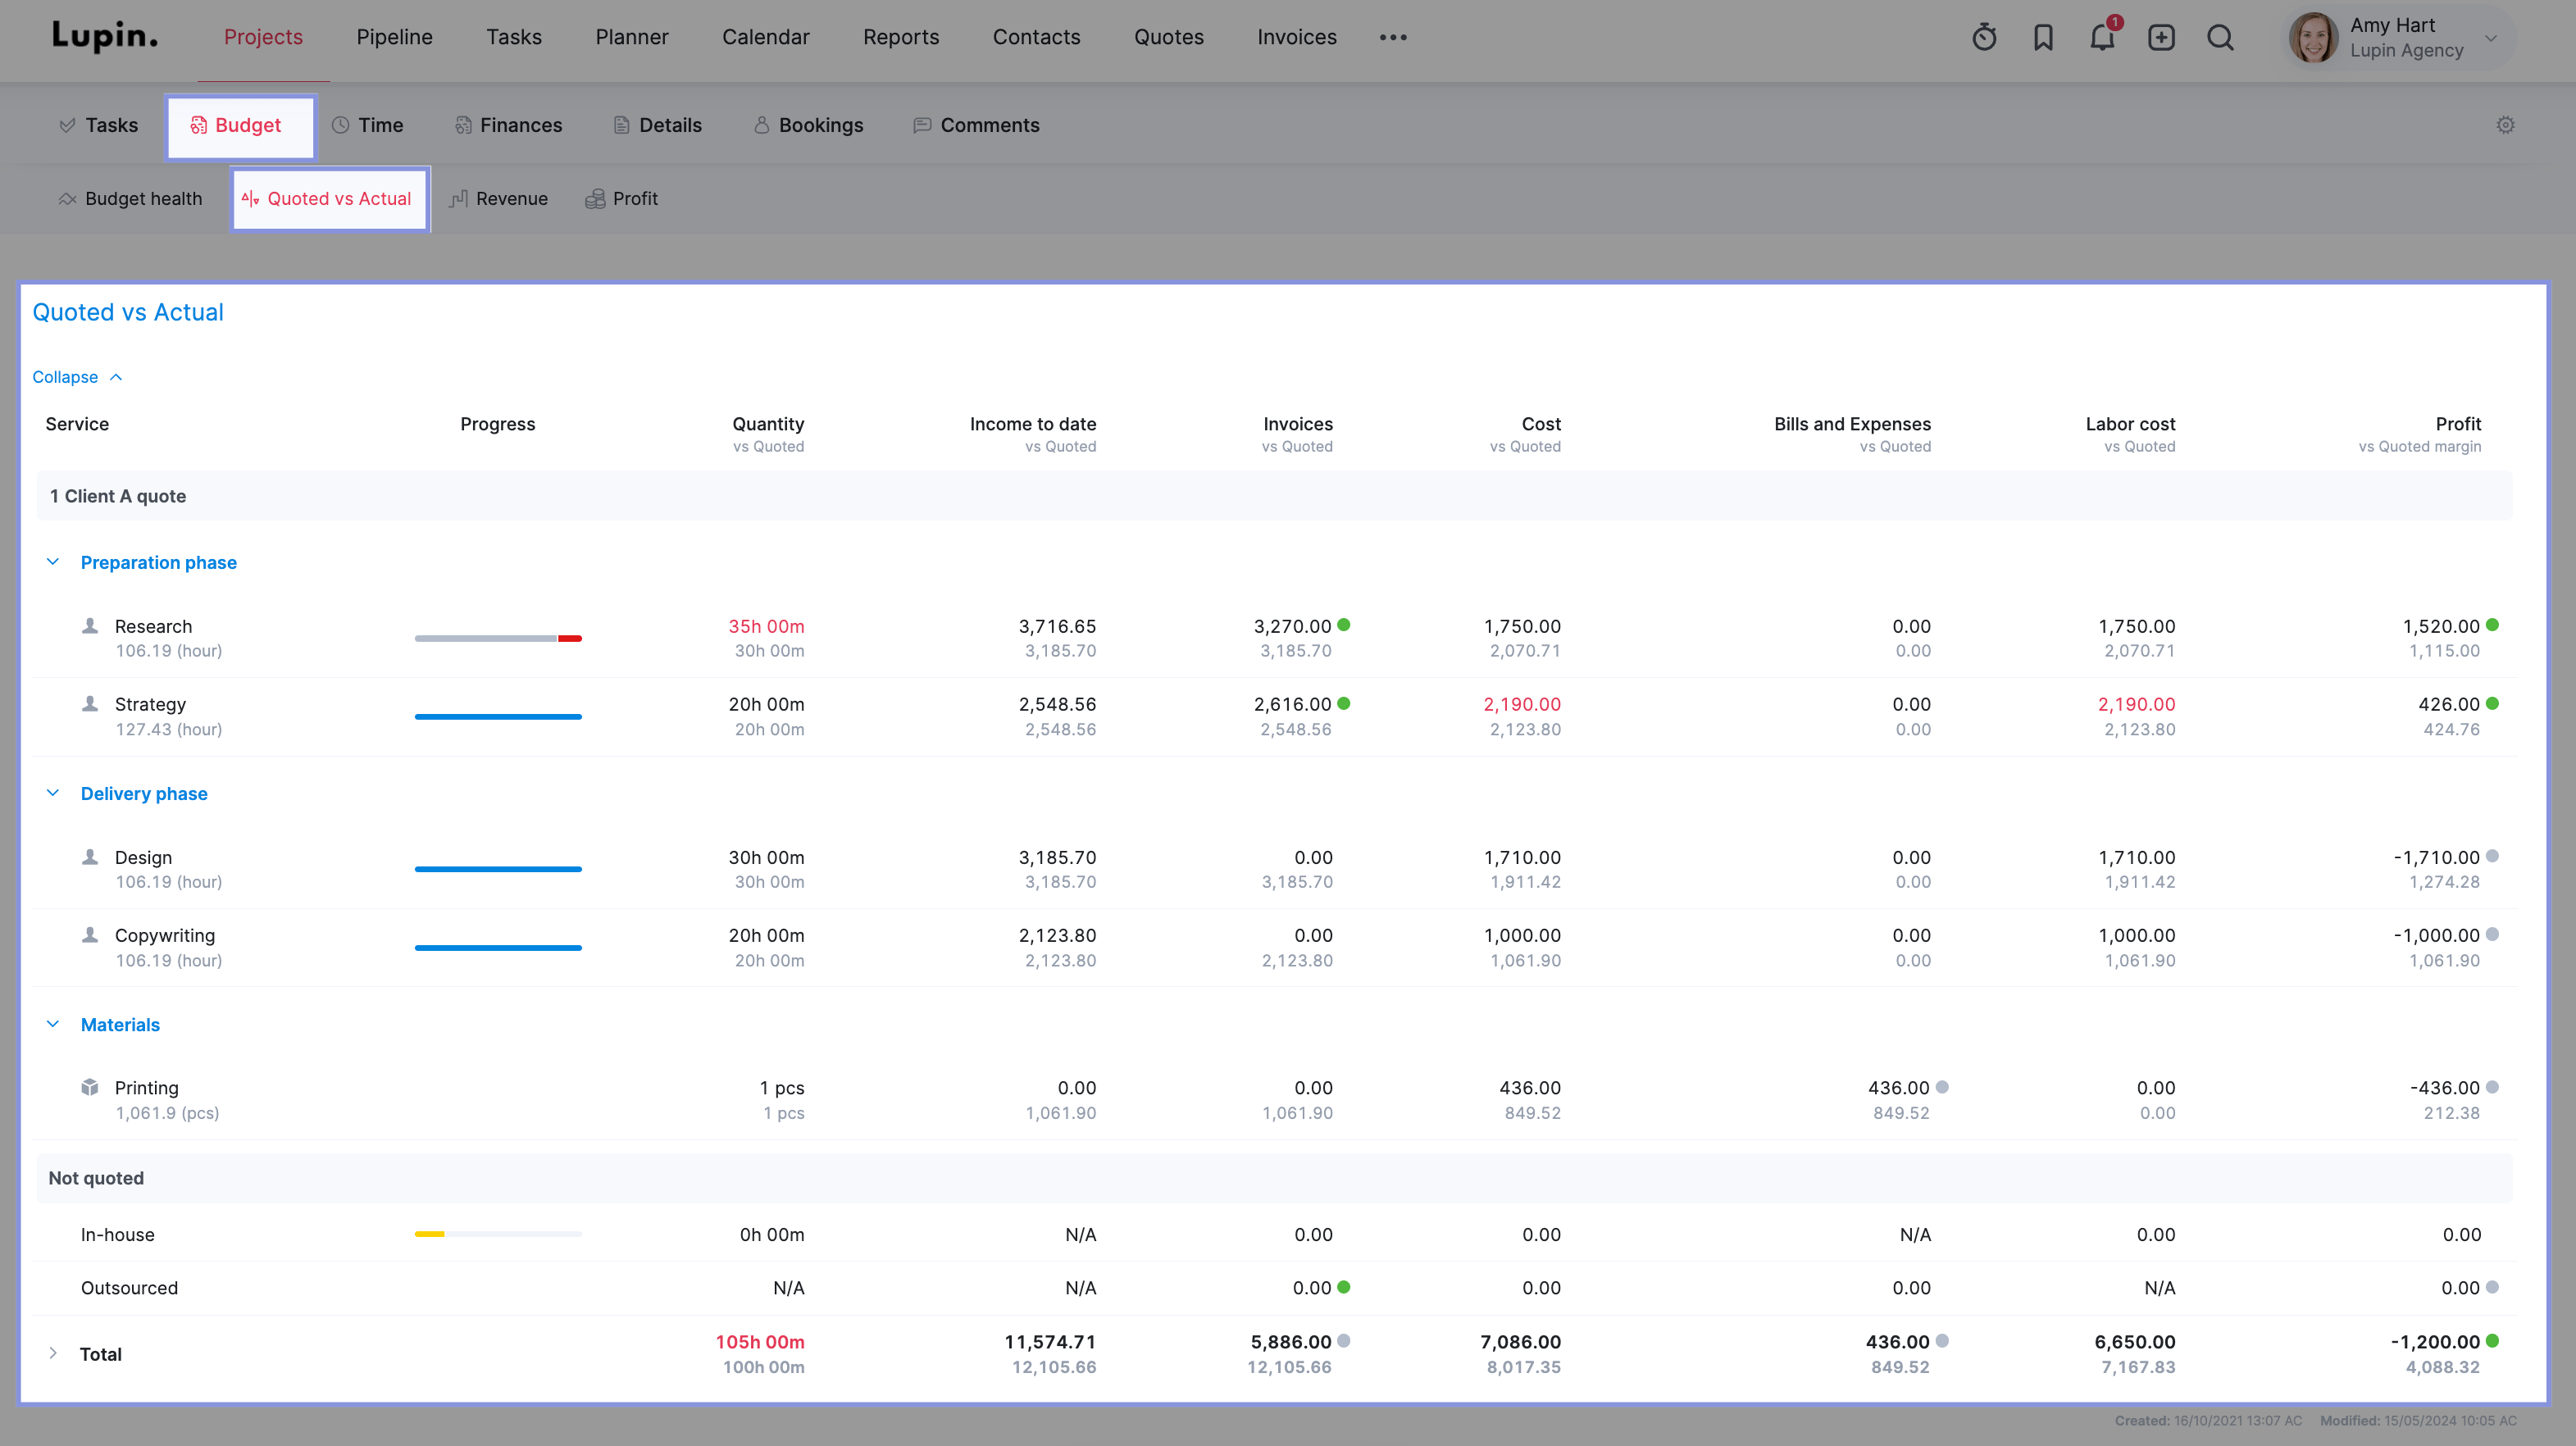
In Scoro, you can see project budget vs. actual costs through the “Quoted vs Actual” table. Go to a specific project view, click “Budget,” then “Quoted vs. Actual.”
Here, you’ll see a breakdown of each project phase and budgeted costs, revenue, actual costs, and profit. Actuals are shown in black, while quoted amounts are in gray text. And at the bottom of the page, you’ll see the total amounts for the full quote.
13. Planned vs. actual time
Planned vs. actual time is a metric that compares the estimated time allotted for a project to the actual time spent working on and completing that project.
Tracking planned vs. actual time is important for several reasons, including:
- More accurate estimates lead to more profitable projects
- Delivering projects on time improves customer satisfaction
- Identifies and reduces scope creep
To calculate planned vs. actual time, compare the estimated time for each project task or phase to the actual time spent.
For example, if you estimated 20 hours for a design phase, but it took 25 hours, your planned vs. actual time for that phase would be:
- Planned time: 20 hours
- Actual time: 25 hours
- Difference: 5 hours over the estimate
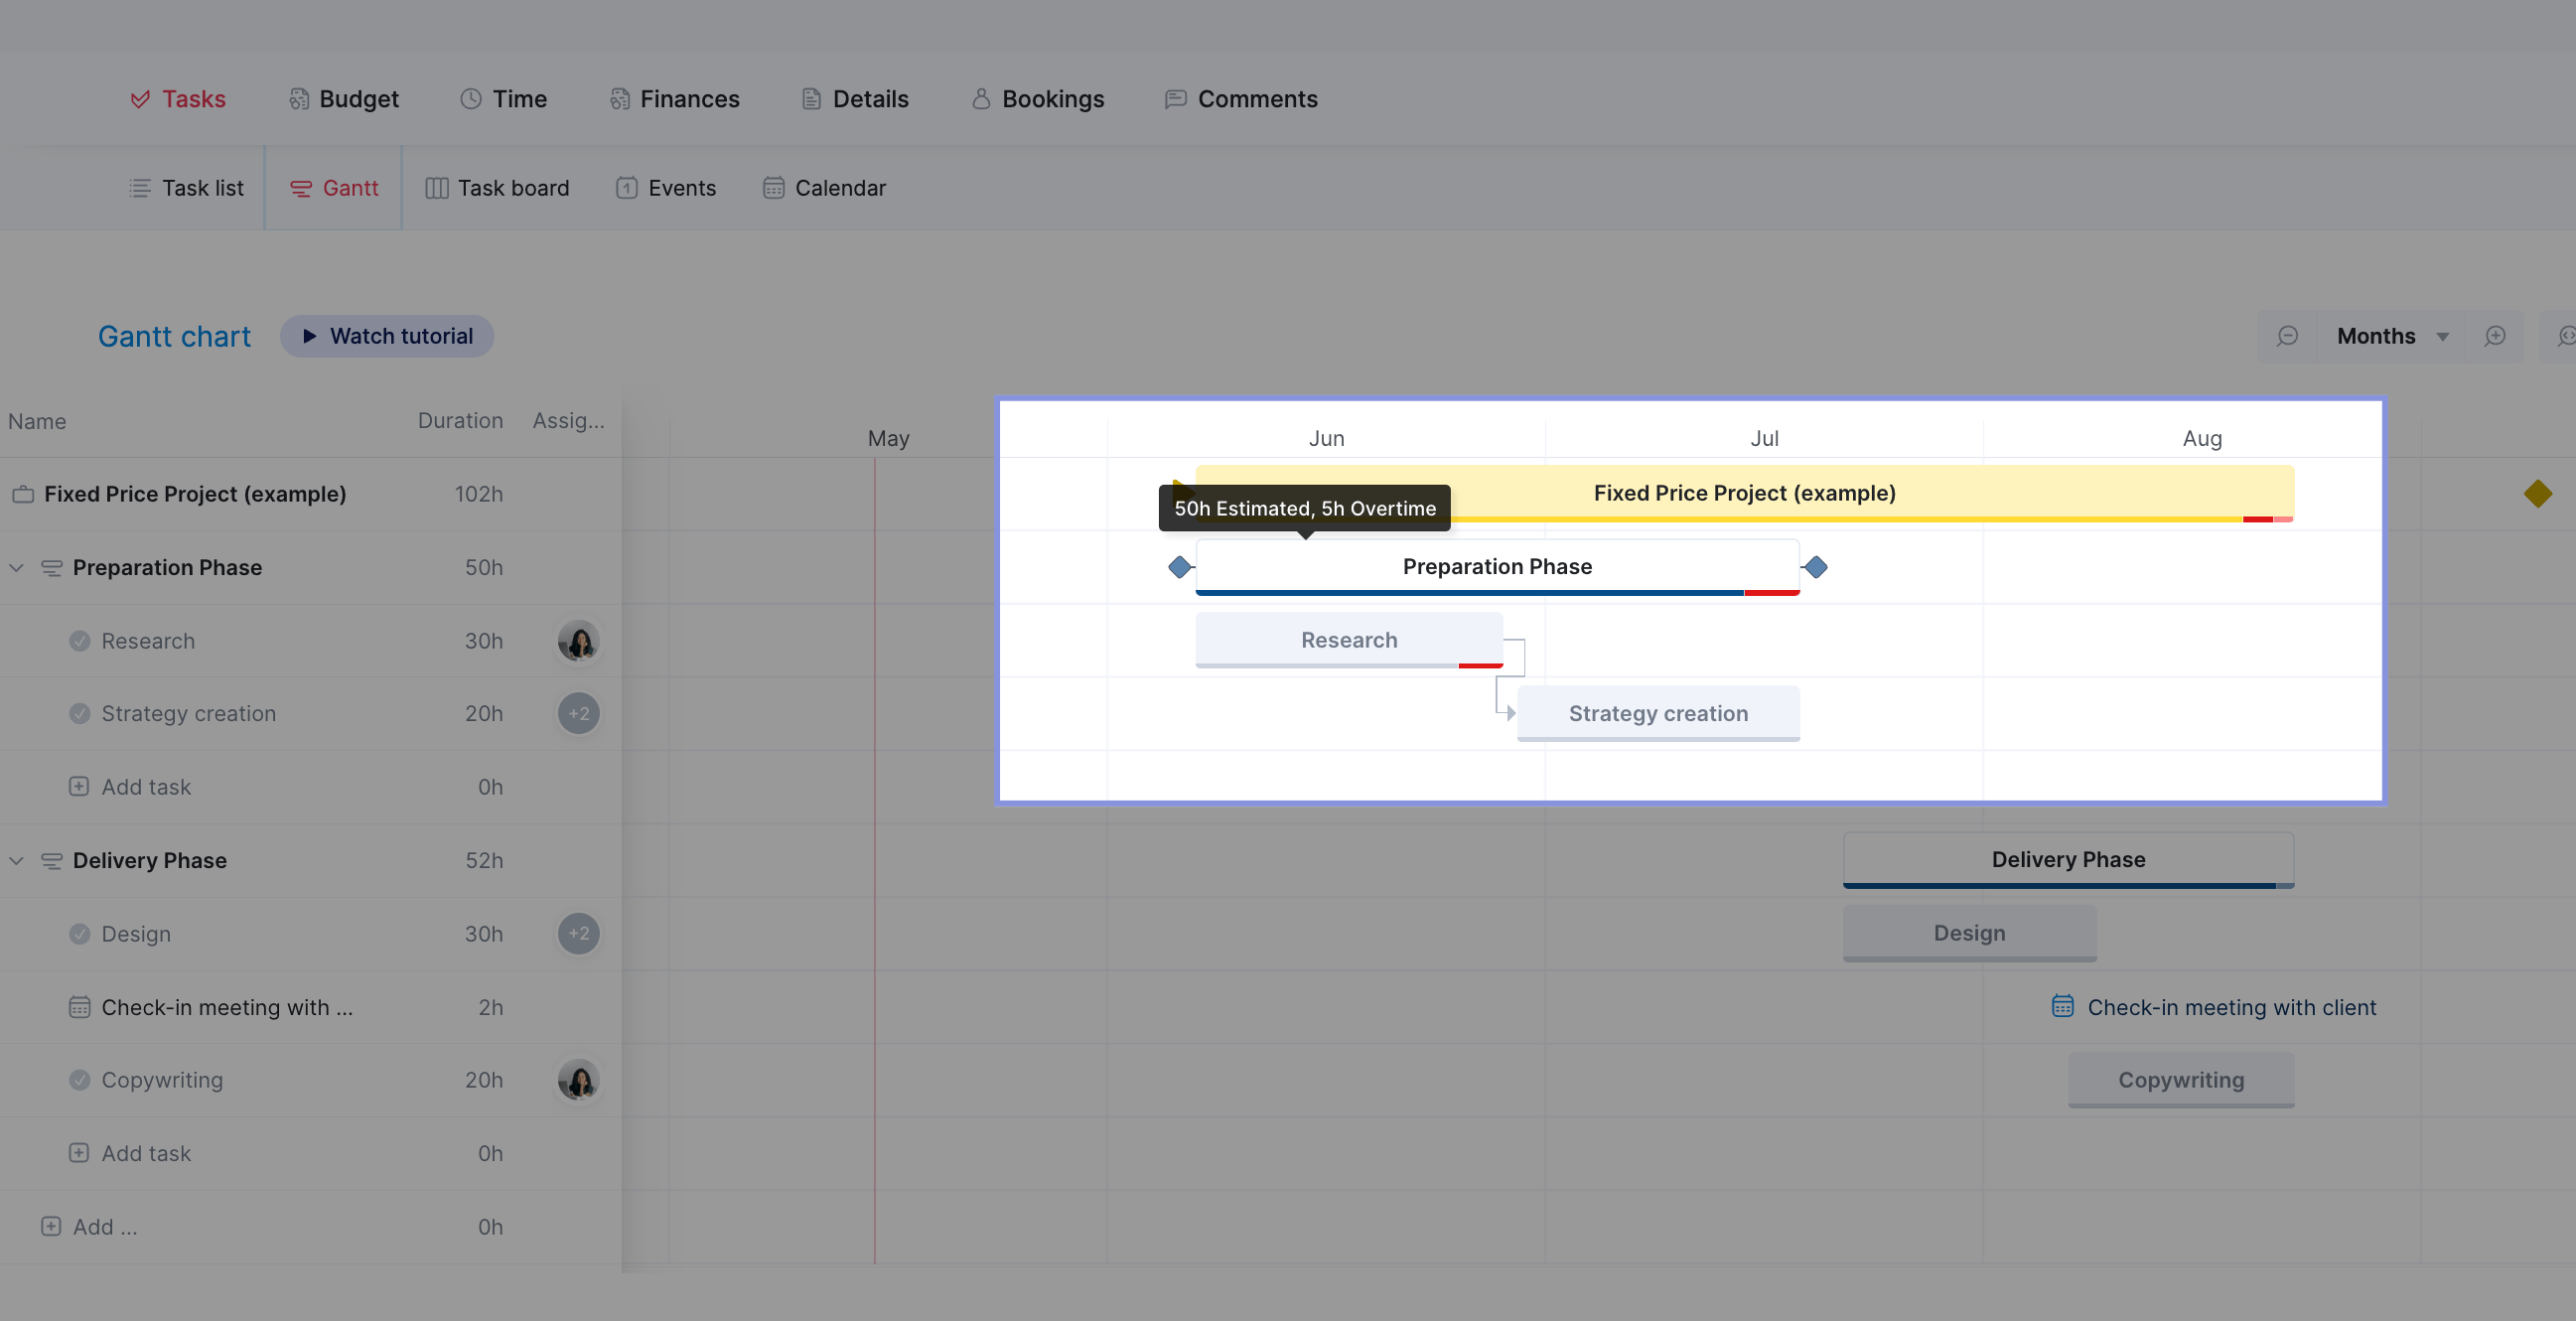
Within Scoro, the “Gantt” chart view offers a visual representation of project task durations, allowing you to compare the initially estimated time against the actual time invested by your team.
To access this view, go to the “Projects” module, select a specific project, then go to the “Tasks” section and choose the “Gantt” tab. This will display a Gantt chart outlining your tasks and the project timeline.
The progress bar for each task provides a visual cue on how the task is advancing compared to the planned duration. The progress line will turn red if the time exceeds the estimated hours.
By hovering over the task name, you can quickly view the breakdown of the estimated time, the time already completed, and any overtime accrued so far.
Sales metrics
Sales metrics show you exactly how much value your pipeline has and what value you can reasonably win based on historical data. These three sales metrics are critical for agencies of all sizes.
14. Value of deals expected to win
The value of deals expected to win is exactly what it sounds like. This shows you the amount of deals you expect to win and the total revenue.
This metric helps you predict whether you’re on track, off track, or even exceeding your sales targets..
Let’s say your agency has a total pipeline value of $500,000 for the upcoming quarter. You’ve categorized your deals based on their likelihood of closing:
- $200,000 in deals with a 75% or higher chance of closing
- $150,000 in deals with a 50-74% chance of closing
- $100,000 in deals with a 25-49% chance of closing
- $50,000 in deals with a less than 25% chance of closing
In this case, the value of deals expected to win would be $350,000 ($200,000 + $150,000), as based on your historical data and current pipeline status, these deals are 50% or more likely to close.
Essentially, this metric allows you to forecast whether you will hit, exceed, or fall short of revenue goals. It enables you to adjust resource allocation proactively—whether ramping up sales or delivery capacity—to align with your projected revenue picture and maintain profitability.
Scoro’s “Pipeline report” will help you monitor this metric based on your sales goals and predictions. You can define closing probability rates for each stage in your pipeline and set an estimated closing date for each deal.
Go to “Reports,” then “Pipeline report.”
The “Pipeline report” shows your predicted future sales based on the information you provide about your deals.
You control this data:
- For each deal in your pipeline, you estimate when you think it will likely close by setting an expected closing date.
- You also define the probability percentages for deals closing at each stage of your sales process.
The report then calculates and displays weighted sales projections for upcoming months using these closing date estimates and probability rates you assign.
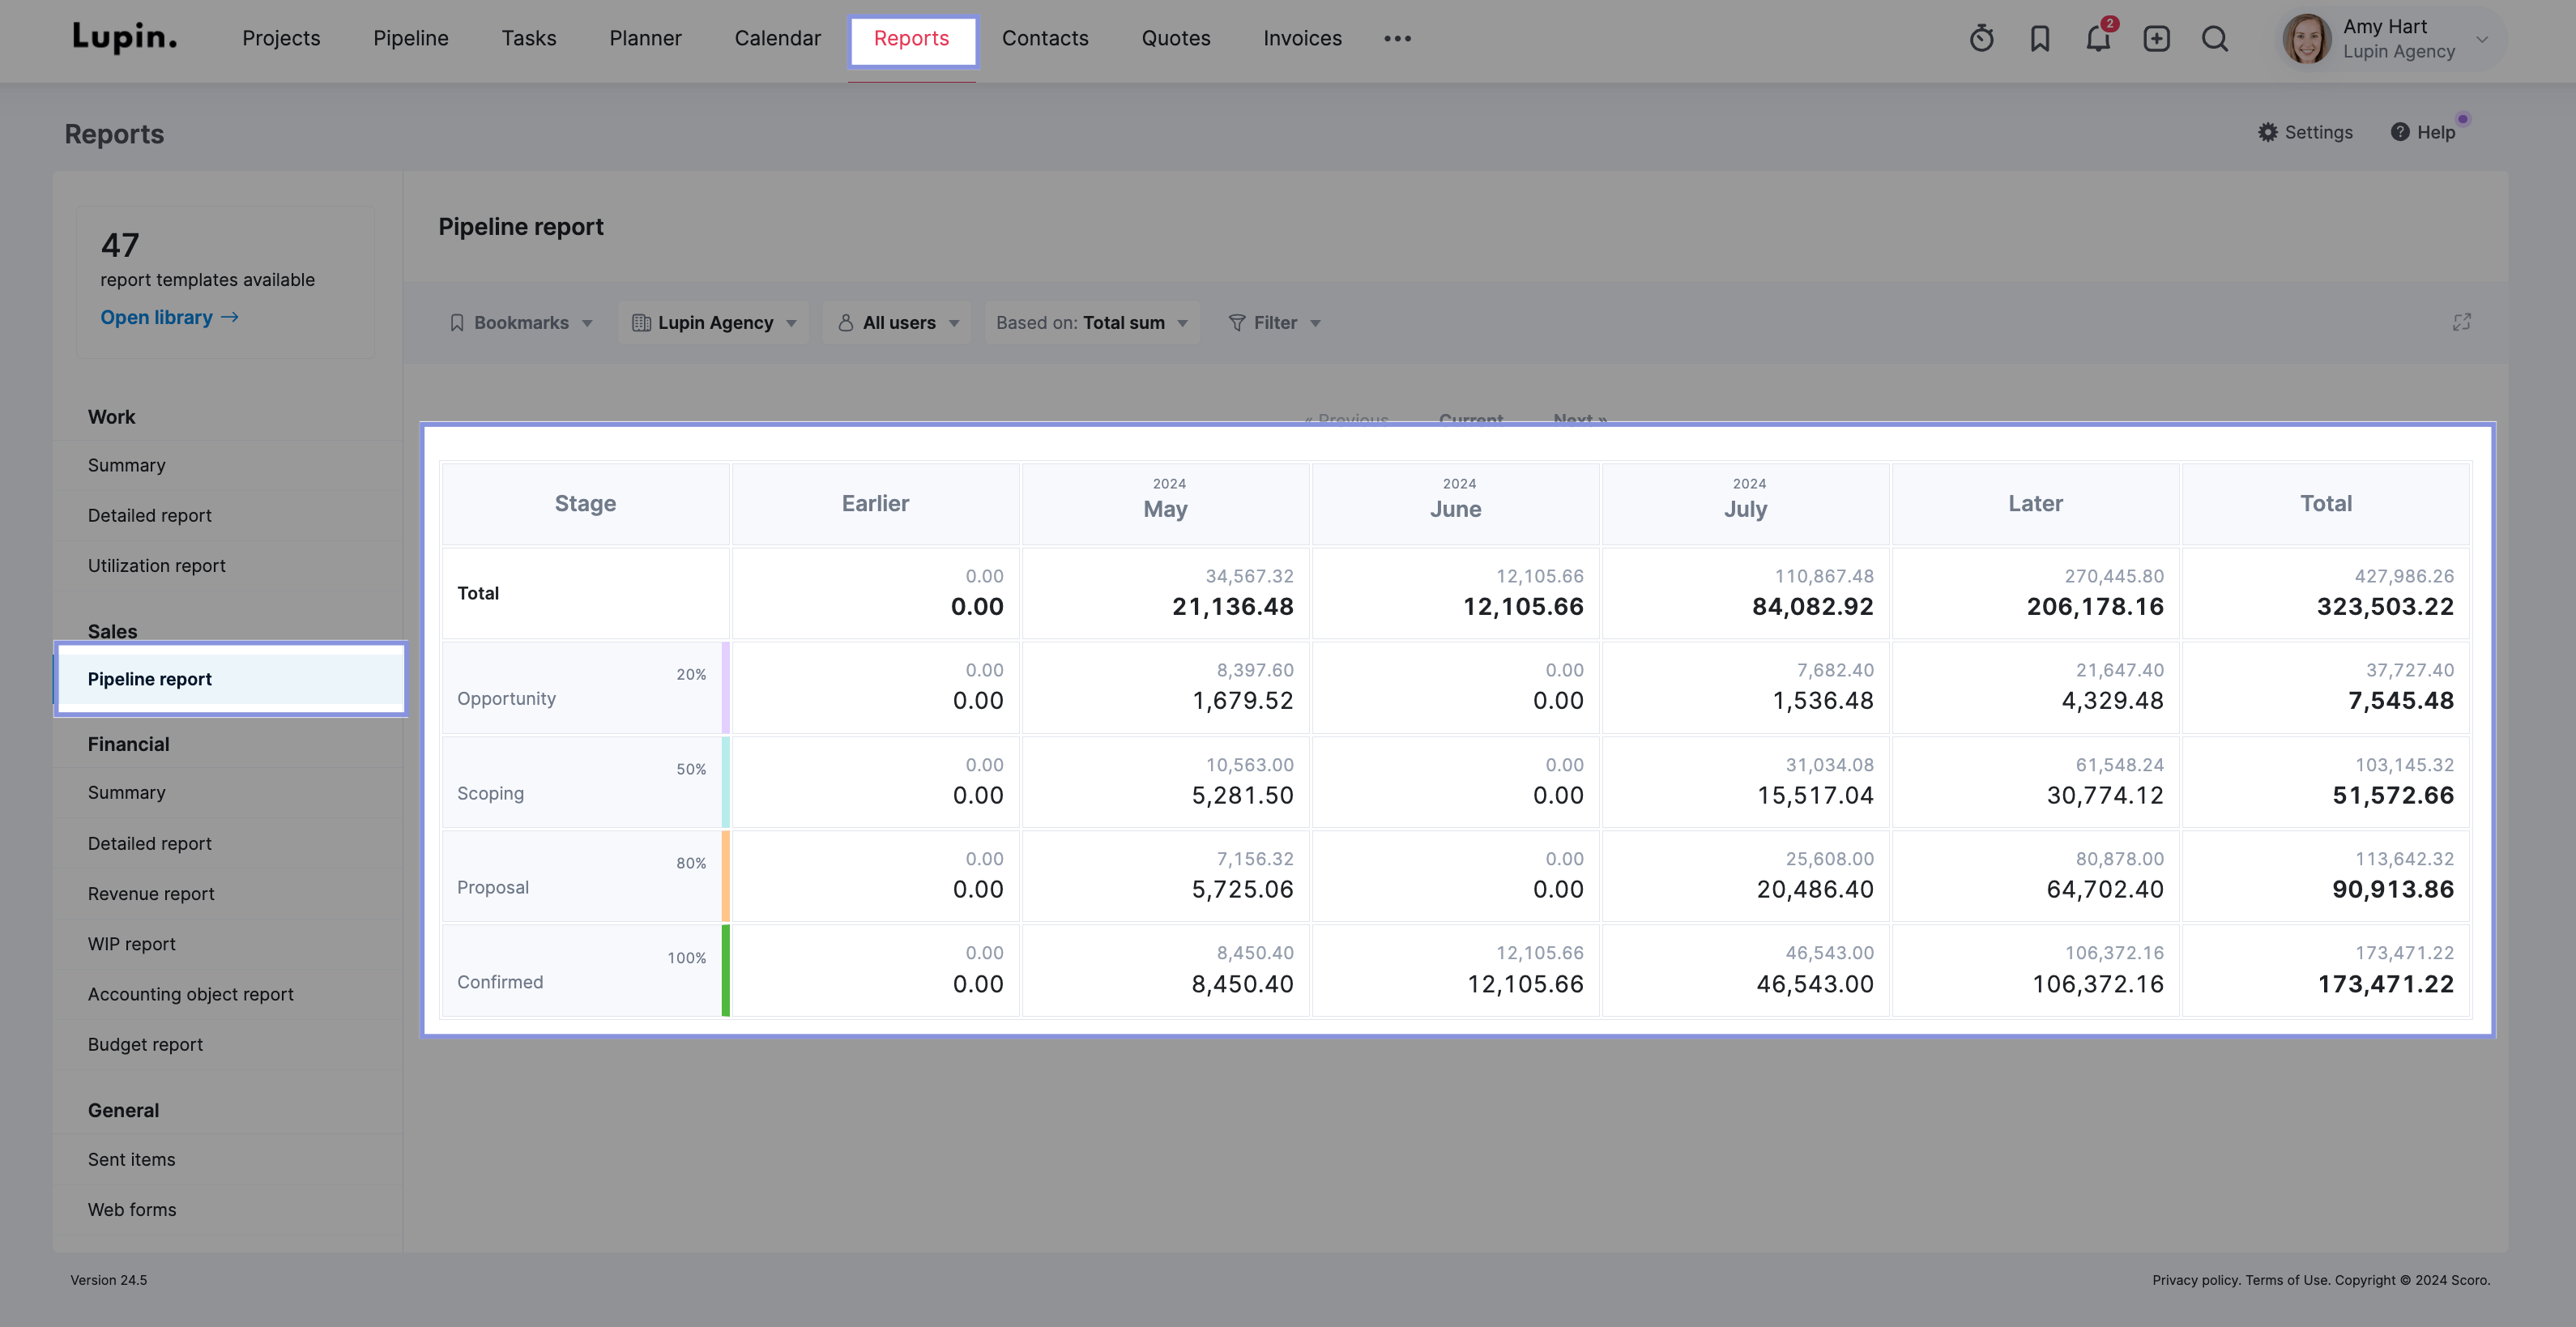
To better understand the value of deals expected to win, you can use the “Status” filter and sort by “Scoping” and “Proposal” (for example) to view only those stages that are likely to convert.
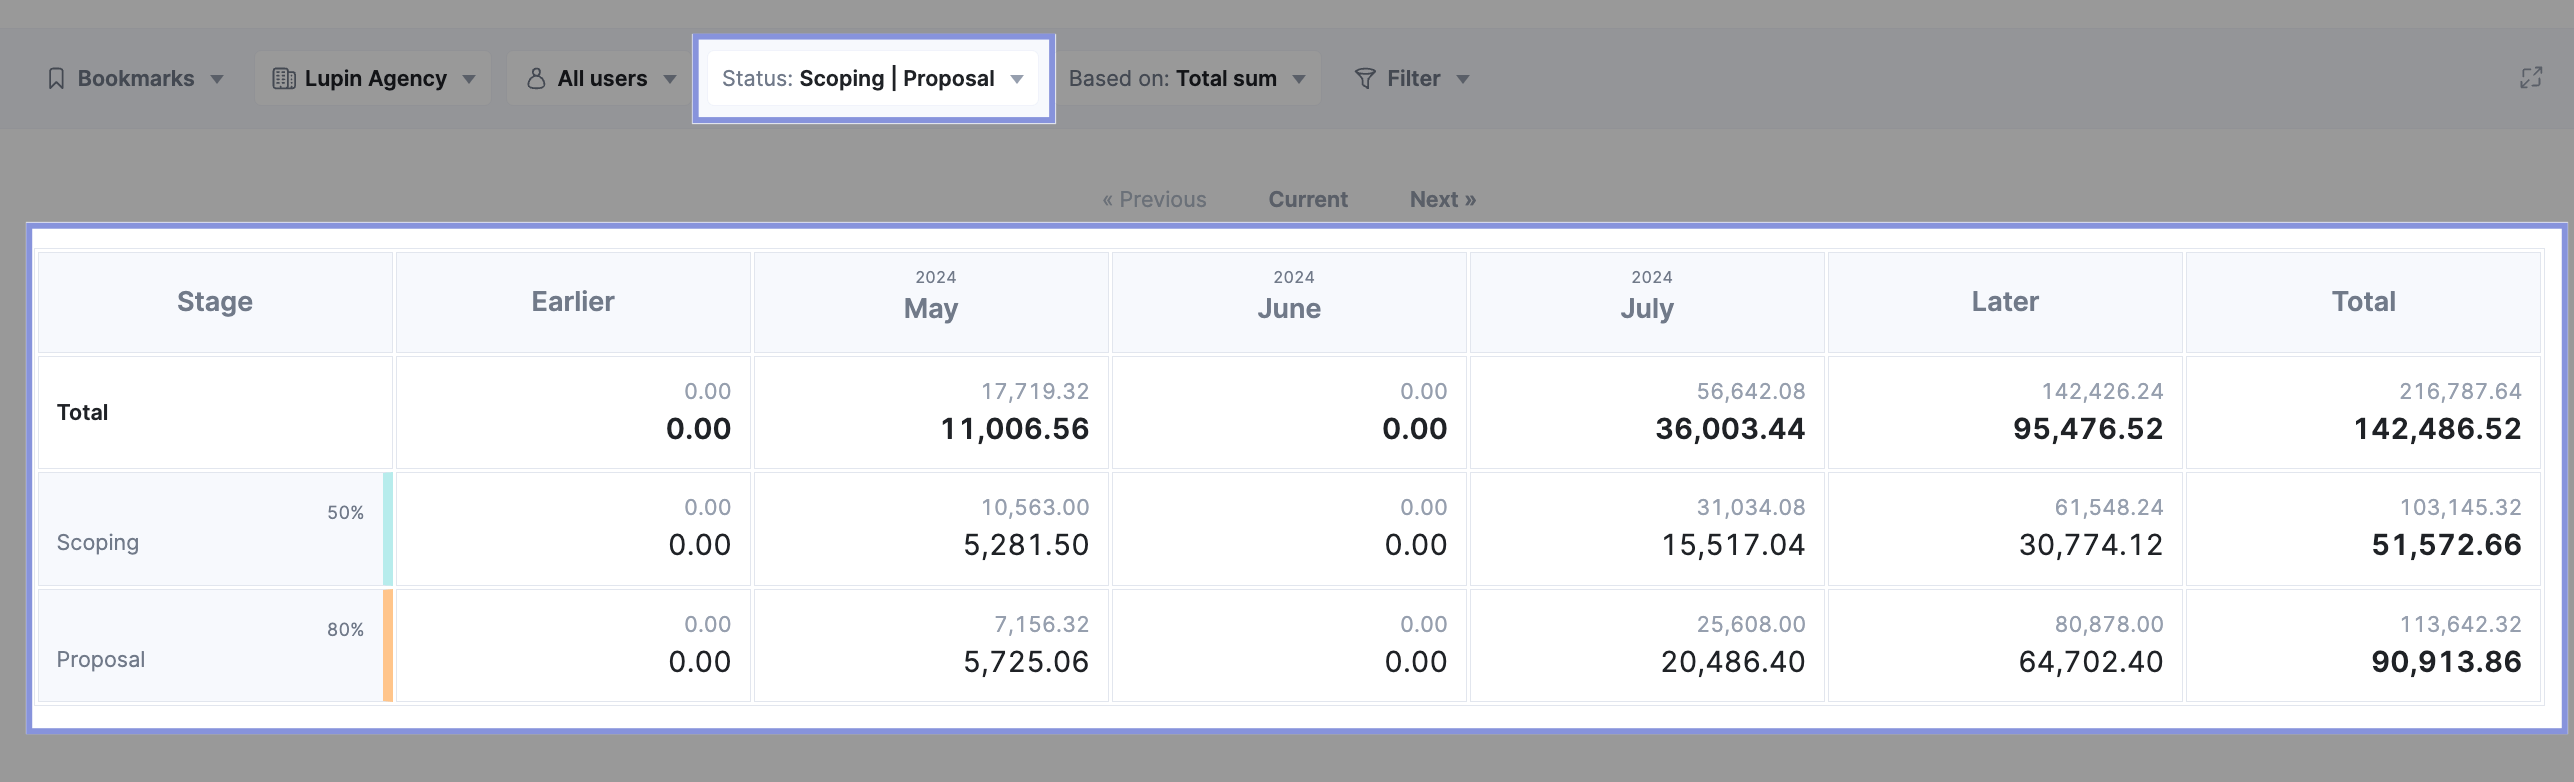
Now, you can see exactly where your pipeline stands and where to focus your energy to ensure profitability for upcoming months.

15. Value of closed deals
The value of closed deals is the total value (or revenue) of closed deals over a given time frame, such as a month, quarter, or year.
This is the next stage in your pipeline after “expected to win.” Similarly, it gives you a great look at whether you’re under-target, over-target, or on-target and what you might need to do to adjust and ensure profitability and on-time project delivery.
Let’s say your agency has closed the following deals in Q2:
- Project A: $75,000
- Project B: $50,000
- Project C: $30,000
- Project D: $20,000
The total value of closed deals for Q2 would be $175,000 ($75,000 + $50,000 + $30,000 + $20,000).
If your Q2 revenue target were $150,000, this would indicate that you’re over-target by $25,000. On the other hand, if your target was $200,000, you’d be under-target by $25,000 and may need to adjust your sales strategies or pipeline management.
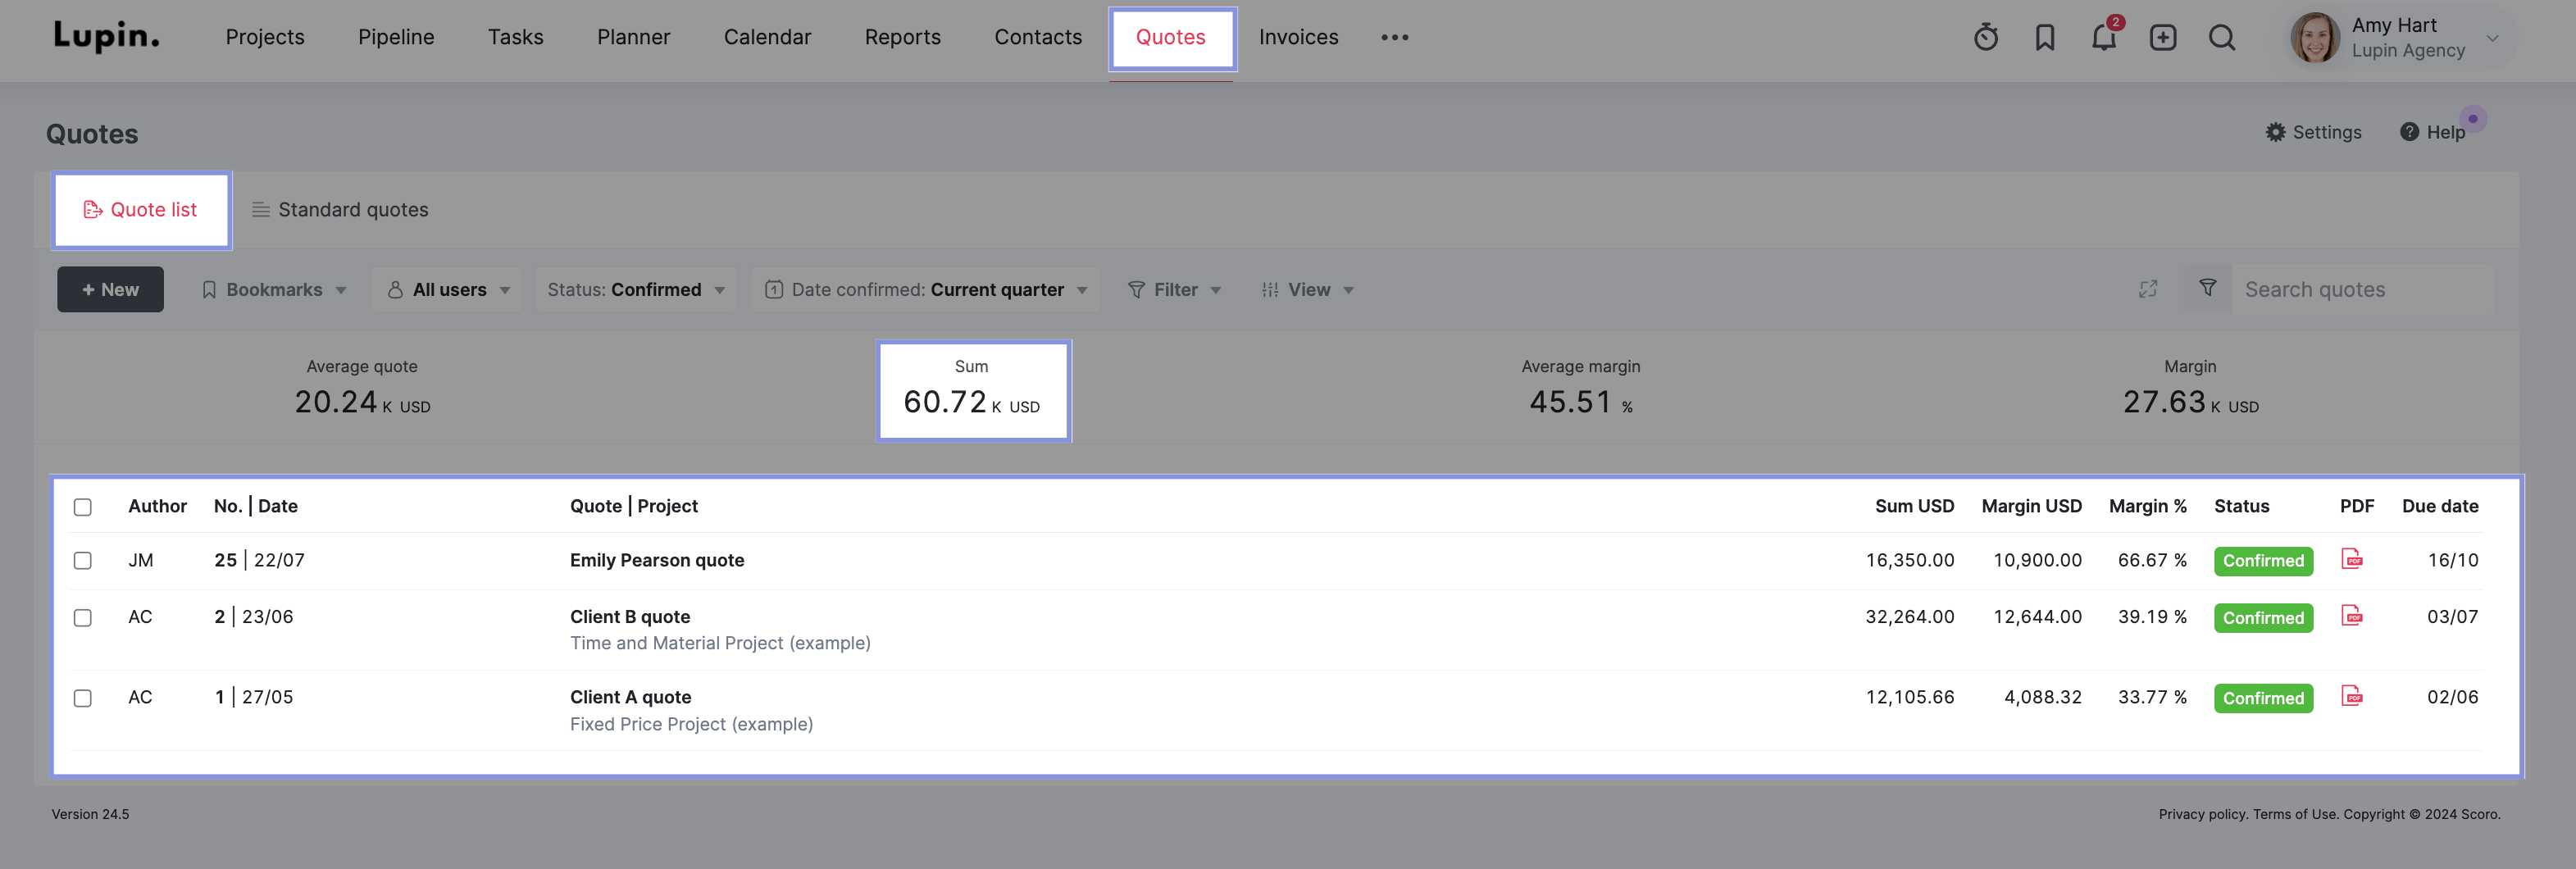
This metric can be seen in numerous places in Scoro, but the “Quotes” view is the most detailed.
Go to “Quotes” from the top menu and view the “Quotes list,” which will show you all of your agency’s created quotes.
Sort by “Status: Confirmed” and then choose the date range you want to analyze, for example, “Current quarter.”
Now, you’ll see a list of all confirmed quotes for this quarter and high-level and per-project data for each.
The “Summary bar” at the top shows the value of closed deals in the “Sum” data point. This is the total value of all closed deals in this period.
16. Sales conversion rates
Sales conversion rates show the value or number of deals won compared to the total number of deals, expressed as a percentage.
You can use the following formula to calculate the conversion rate:
Sales Conversion Rate = (Number of Deals Won) / (Number of Total Deals) x 100
Where:
- Number of Deals Won = The deals that successfully closed/converted to sales over a given period.
- Number of Total Deals = The total count of deals that either won or lost/did not convert over that same period.
For example, you’ve made 10 deals over the last quarter. Of those, you’ve won 3 and lost 7, which means your conversion rate is 30%.
Understanding your conversion rates allows you to better estimate pipeline forecasting by predicting the percentage of deals that will close. It also allows you to set more accurate sales targets.
If you know you’re likely to convert only 30% of your deals, you can target the right number of outreach pitches to hit the needed conversions for profitability and ideal utilization.
This holds for every stage of your sales process. You can calculate conversion rates for:
- How many outbound calls convert into leads
- How many leads convert into prospects
- How many quoted proposals convert into confirmed sales
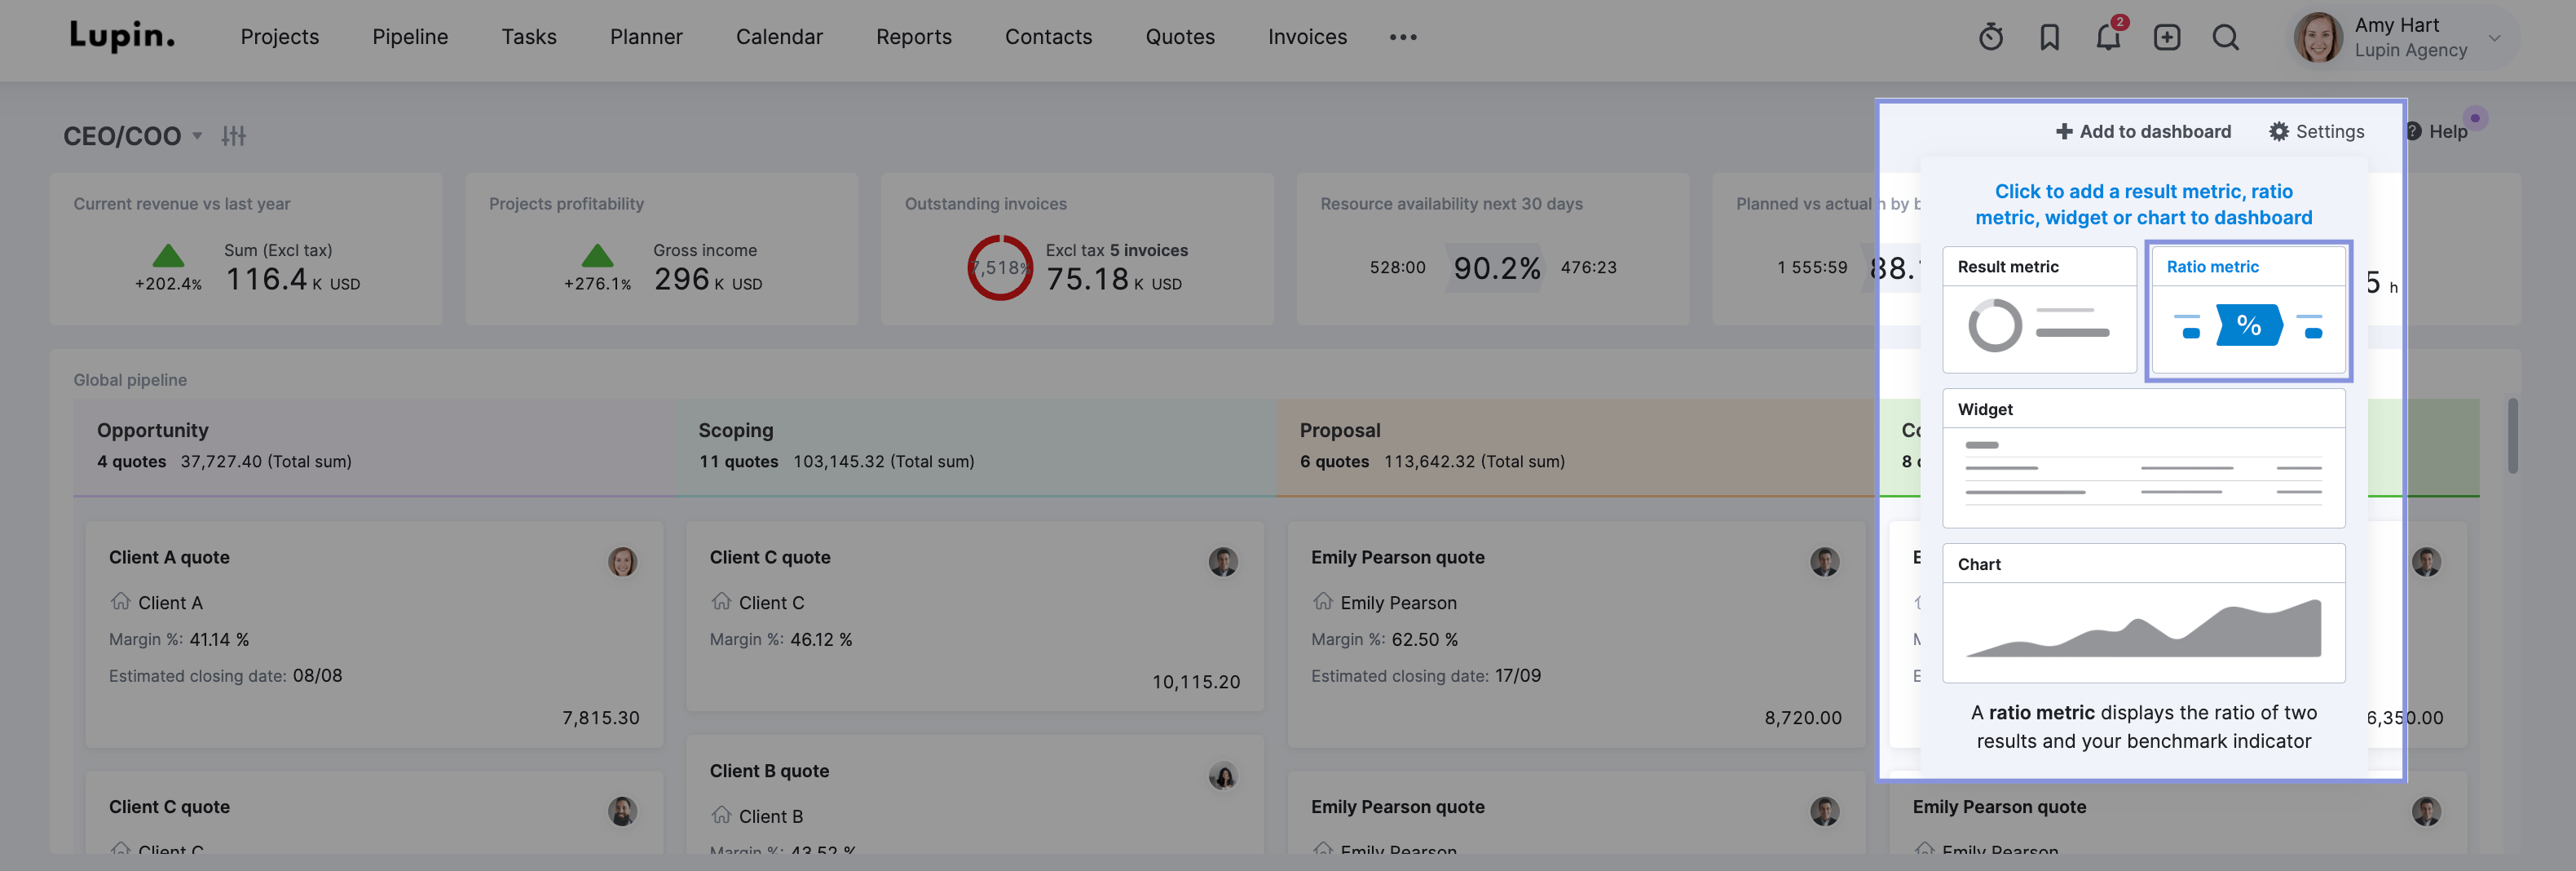
In Scoro, you can track your conversion rate by adding the “Ratio metric” to your “Sales dashboard” to easily calculate this value based on issued quotes with successful deals.
To do this, you’ll go to your dashboard and click “Add to dashboard.” Then, click “Ratio metric.”
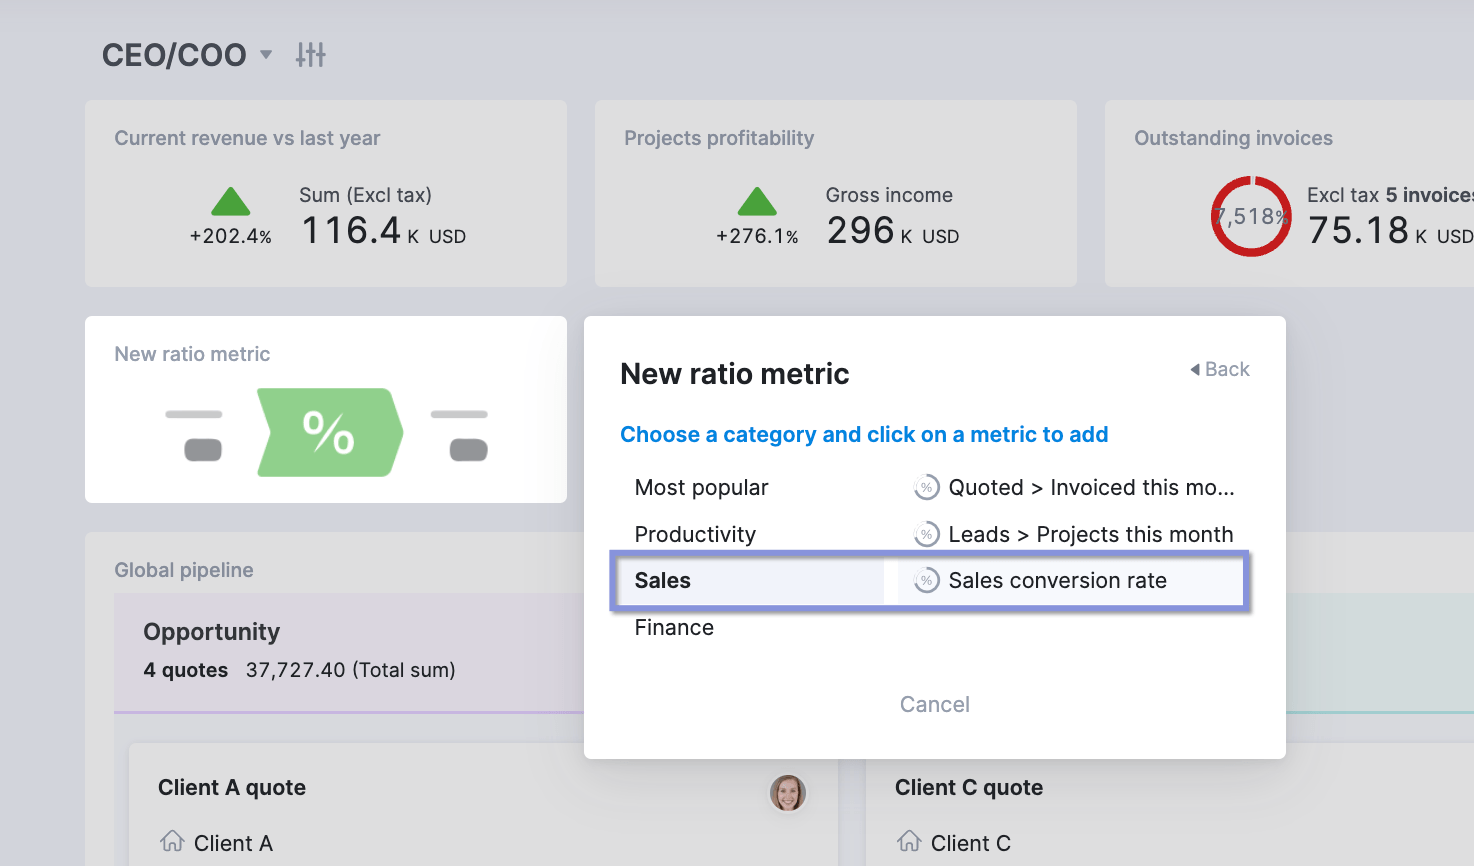
Then, select “Browse bookmarks library.”
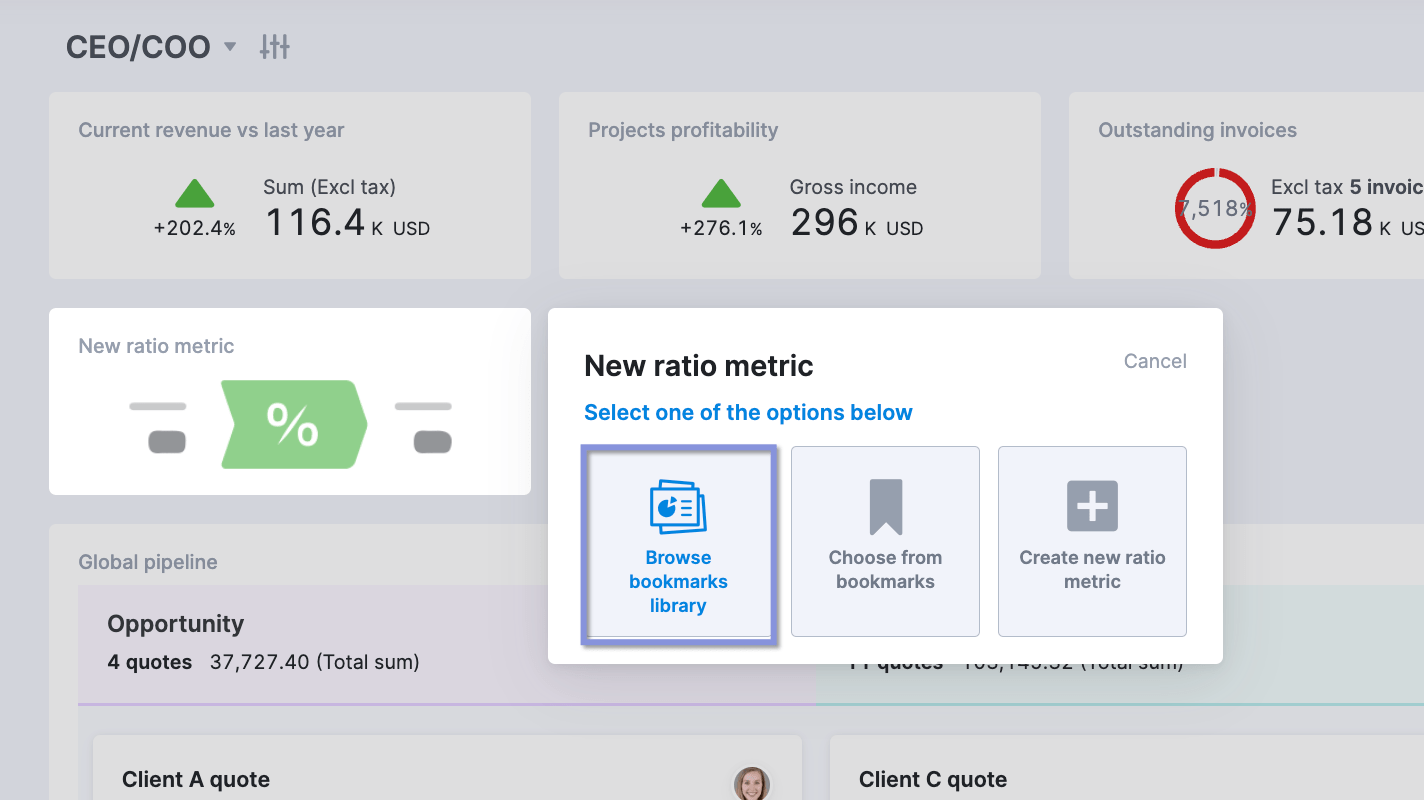
Followed by “Sales” > “Sales conversion rate.”
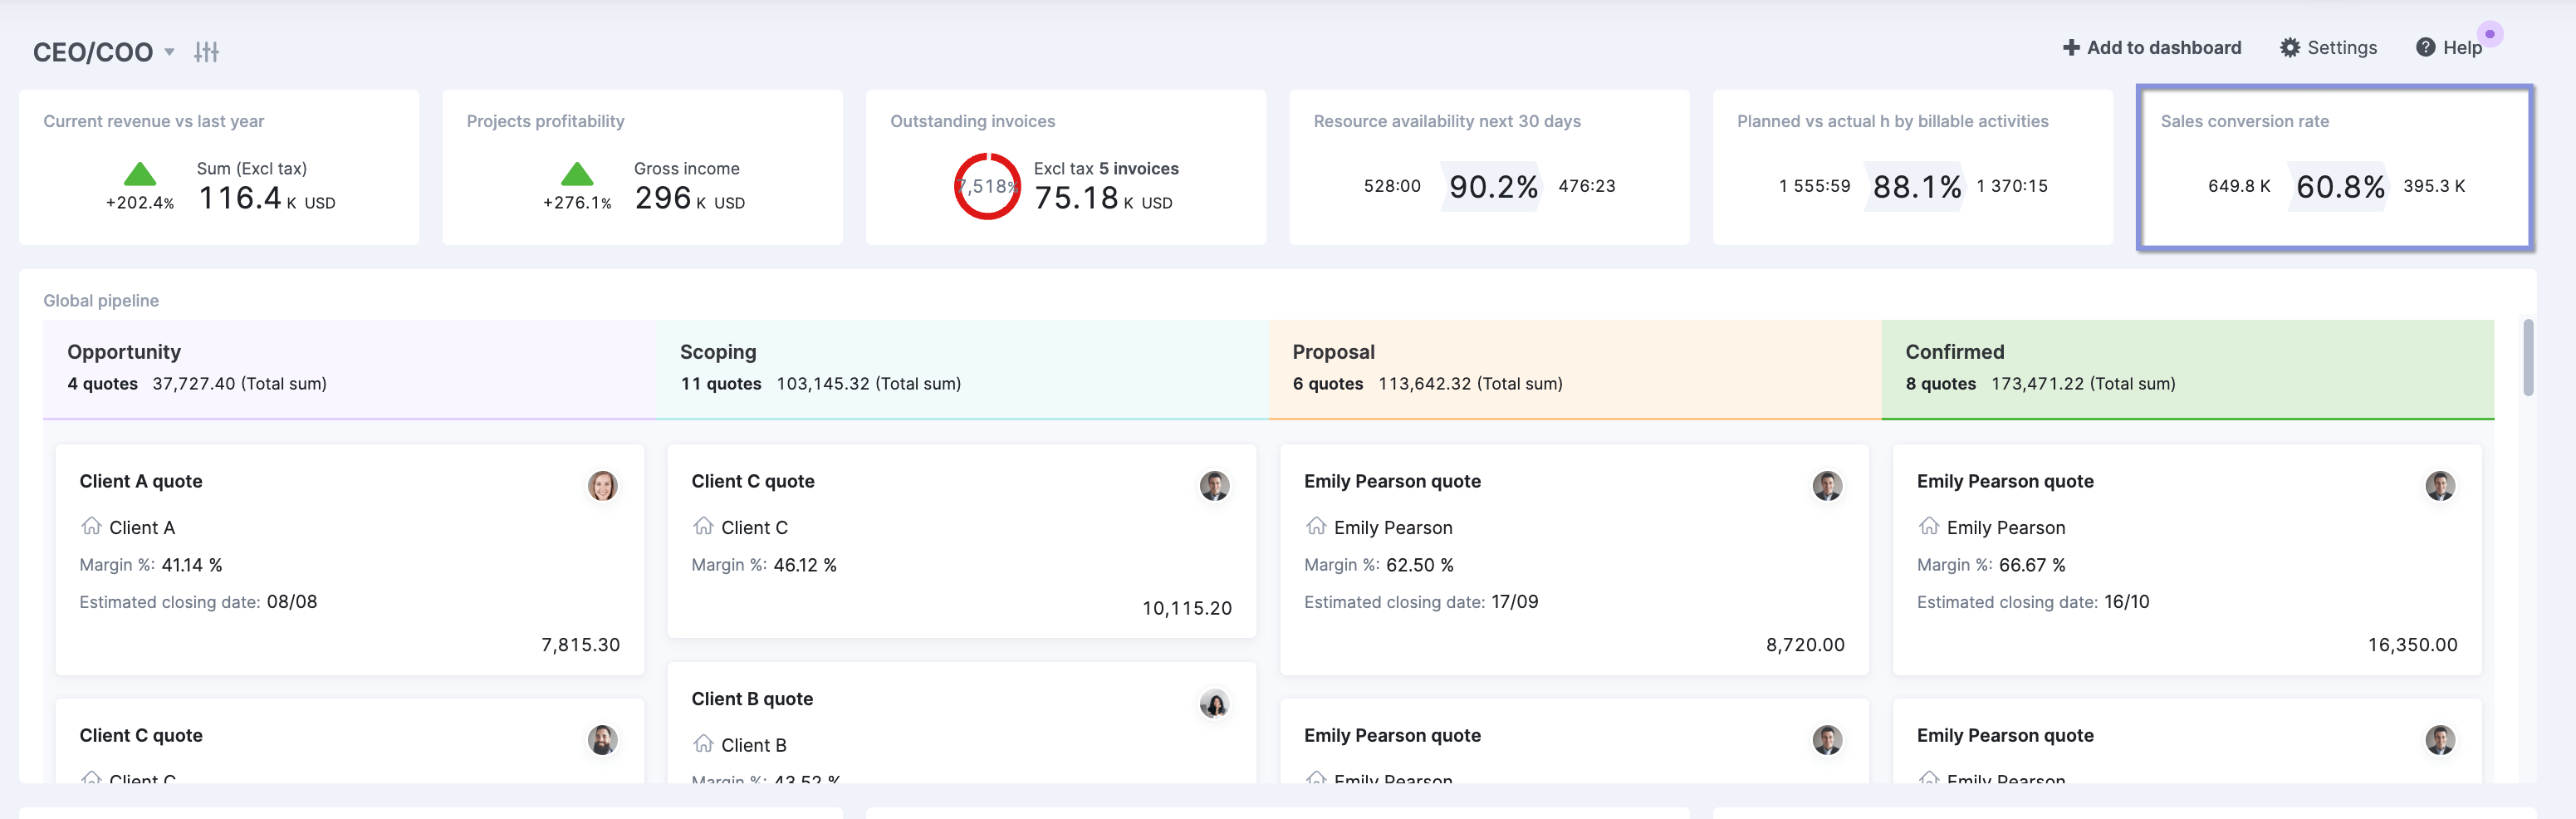
You’ll then see your sales conversion rate on your dashboard.
Keeping track of your agency’s key metrics
Measuring, calculating, and monitoring these metrics can be difficult and time-consuming.
With an all-in-one agency management tool like Scoro, you can create custom dashboards that give you and all of your key stakeholders automatic, at-a-glance views of every key metric and data point that are updated in real-time.
No more pulling data manually, updating spreadsheets or constantly updating your executive team.