In the data business, backup and redundancy is paramount. And there is a saying: ‘If you only have one copy, you have no copies.’
My approach to Project Management has a similar philosophy: ‘If you only have one tool, you have no tools.’ I like a big selection of tools to call upon for any Project Management job I may want to take on.
And what could be more important than Stakeholder Analysis?
We need to engage effectively with stakeholders. It is the secret sauce to delivering a successful project. And we can only engage effectively if we understand our stakeholders. This means that I need a whole armful of stakeholder analysis tools in my kit-bag.
In my book, The Influence Agenda: A Systematic Approach to Aligning Stakeholders in Times of Change, I describe over 20 techniques.
That’s too much for a short article. So, here, I want to share with you my eight favorite tools.
Let’s start with the one tool everybody knows. It’s the simple 2×2 grid that appears in almost every basic Project Management book or training course.
All the illustrations are taken from my book about stakeholder engagement, The Influence Agenda: A Systematic Approach to Aligning Stakeholders in Times of Change.
Stakeholder Grid
The ‘standard’ stakeholder map plots stakeholders’ power against interest. That is:
- how much influence and control are they able to bring to bear?
- what is their level of interest or concern in your project or its outcomes?
This gives us a familiar grid like the one illustrated below.
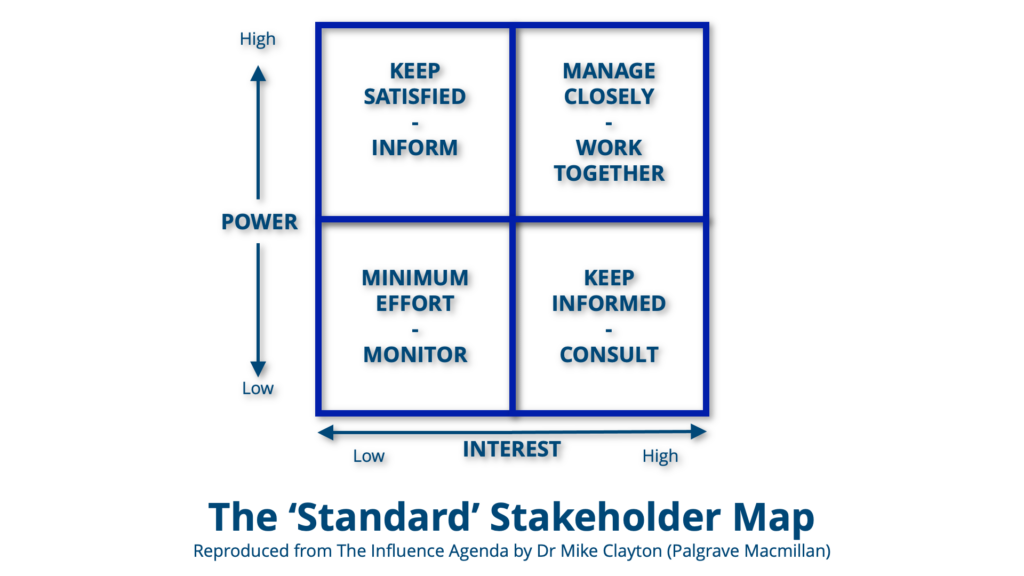
In the boxes, we see an indication of the kinds of strategies that are appropriate. How you carry them out will then be part of the planning phase of your stakeholder engagement management process.
- High Power – Low Interest
These stakeholders are not highly motivated to intervene but, if they do decide to, they can have a big impact. So, keep them up-to-date and satisfied that you are taking account of their interests. - Low Power – High Interest
These stakeholders want to have their say and feel they are being heard, but they aren’t especially influential – unless they find new ways to exert power. So, consult them wherever appropriate, and keep them up-to-date on what’s happening. - High Power – High Interest
These are your highest priority stakeholders. So, work as closely with them as you can to keep their attitudes favorable and address their concerns quickly. - Low Power – Low Interest
These are stakeholders who have little inclination to get involved, and little ability to influence the situation. So, inform them through low-effort broadcast methods, but keep an eye on them, in case their levels of interest or power evolve.
Stakeholder triage
I prefer an alternative form of a stakeholder map that I refer to as a stakeholder triage. This represents stakeholders’ attitude to your project against the potential impact they can have on what you are doing, which gives the chart below.
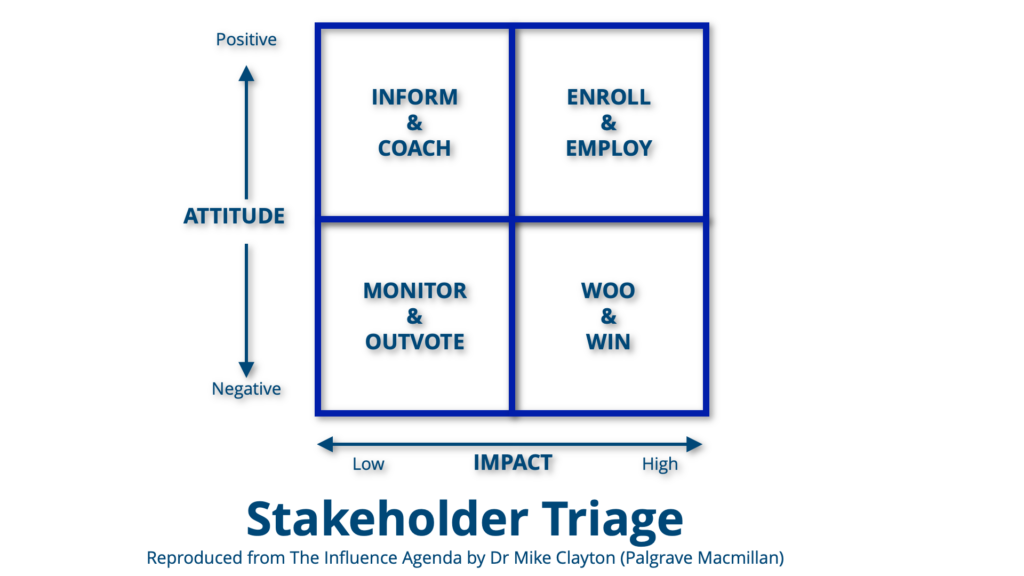
- High Impact – Negative Attitude
These are your highest priority stakeholders. So, you must invest time and effort into winning them over or, at the least, neutralizing their opposition to your project. - Low Impact – Positive Attitude
These stakeholders like what you are doing, so your strategy should be to keep them informed and advise them on how they can best support you, your team, and the project as a whole. - High Impact – Positive Attitude
You’ll love these stakeholders. They want to help, and they can be influential. So, bring them into your wider team and engage their support. - Low Impact – Negative Attitude
They don’t like what you are doing but don’t have a lot of influence. However, that can change. So, deploy low-level efforts to win them over, while keeping an eye on them to ensure they don’t find ways to exert some influence. If necessary, you may need to override their concerns.
Persona Cards
When marketers want to devise a marketing campaign, they need to know who their messages will be talking to. They construct buyer personas (or avatars). These are written descriptions of a typical person who fits a specific category of potential buyer.
We can do the same. I like to create persona cards to represent the typical stakeholders within the various stakeholder groups I will need to engage with. The cards contain a pen portrait, along with key information, like:
- Affiliation
- Key characteristics
- Contact details
- Attitudes
- Interests
- Needs
- Power
- Influence
- Impact
Stakeholder Register
A complementary approach to this is to keep all the information in a simple database. A spreadsheet will do fine. This is a stakeholder register that lists your stakeholders and the key information about them. You can extend it to record the communications you have with them, to create a picture of your engagement with and understanding of each stakeholder.
For major, long-term projects, we can take this one step further. There are software tools used by marketing professionals that do this very well. Each stakeholder has a profile and a record of all interactions. This is CRM software, standing for Customer Relationship Management. If your organization uses CRM software, it may be worth investigating whether you can create a project account, to record and track stakeholder interactions.
Sociogram
A sociogram is another tool drawn from another discipline that works brilliantly for us. We can use it to understand the big picture of how our stakeholders relate to one another:
- Who knows whom
- The strengths of the relationships
- Which ways they influence flows
- Who are the important players in the social web
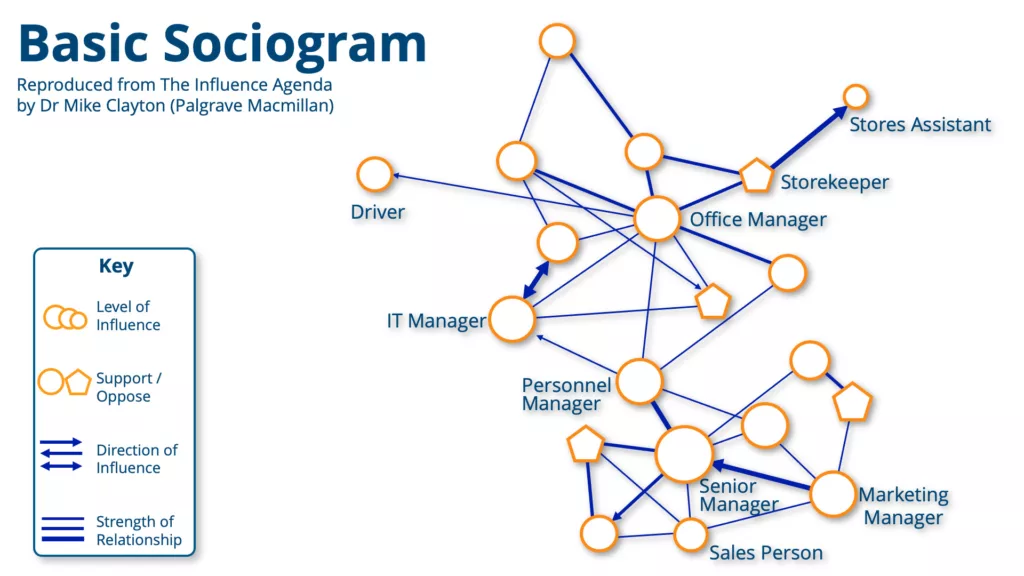
The tool comes from the world of sociology, which is about the dynamics of people. So, it’s an obvious tool for us to co-opt.
We create a sociogram by putting symbols on a sheet of paper to represent each stakeholder (or stakeholder group). Then, we connect those who have a relationship. We can use different line weights to indicate the strength of the relationship, arrows to represent the direction of influence, and different symbols to code for whatever information we want to relay about each stakeholder.
This will often show us who the primary (or ‘apex’) stakeholders are – those whose influence affects many other people, but who are not directly influenced by others. Working with them will be a priority.
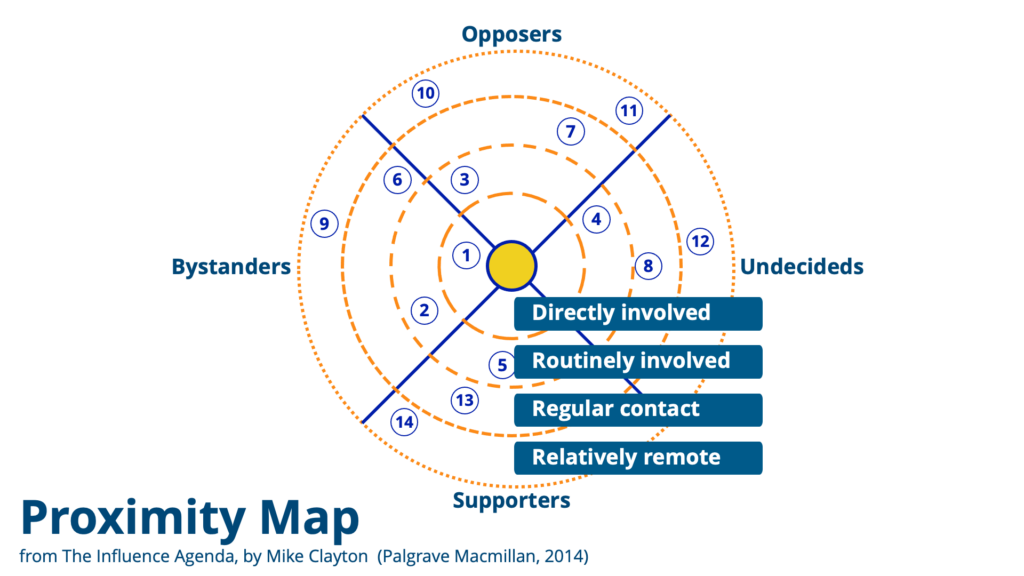
Proximity Chart
At its simplest, a proximity chart shows how close each stakeholder is to the core of the project. Some are deeply involved, whilst others are more peripheral. However, I like to segment the chart into quarters, to also show the stakeholders who are:
- Opposed or antagonistic to what you are doing
- Supportive or sympathetic
- Neutral bystanders who don’t have an opinion
- Undecideds, or floating voters, who will have an opinion, but are still evaluating the information
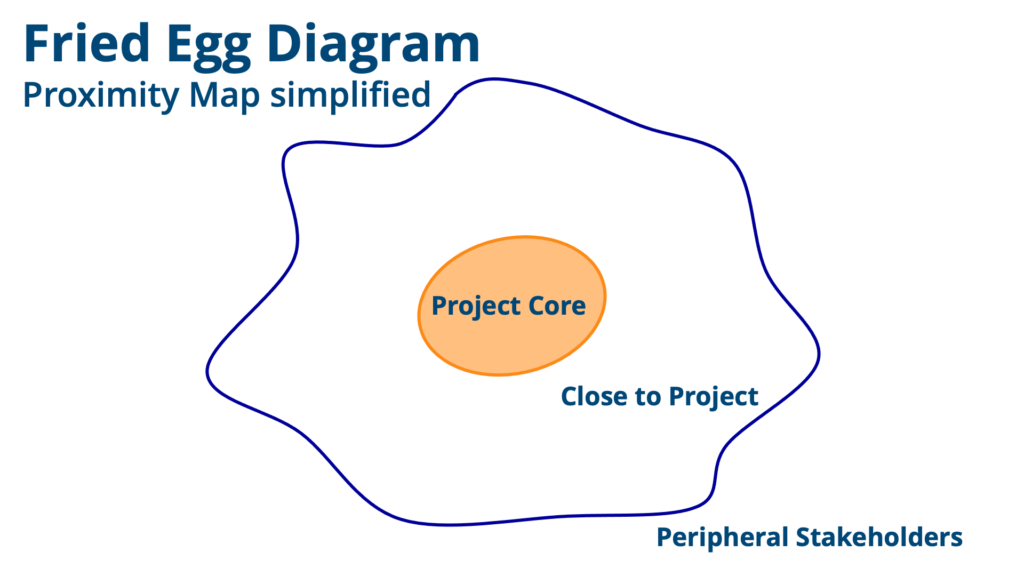
Fried Egg diagram
A colleague introduced me to a simple tool, which is really just a simplified variant of the Proximity Chart. The fried egg diagram is a fun way to facilitate a conversation about who stakeholders are and how ‘important’ they are.
Forcefield Analysis
Finally, I offer you the Forcefield Analysis. This tool offers a simple way to visualize stakeholder forces in your project. It is derived from a similar thinking tool suggested by Kurt Lewin.
Supporters and opposers exert opposite forces on your project, each with a different strength. I use different thickness arrows to show the strength of influence or formal power – the push or pull. You can count the arrows, or the bars on the arrows, to gauge the levels of support and opposition.
And, once again, you can also include:
- Neutrals, who don’t have strong opinion
- Floating voters, who have not yet made up their minds.
The benefit of this tool is that it visualizes the stakeholder perceptions and scales them.
Conclusion
These are my favorite stakeholder analysis tools. I would never use more than two or three at a time, but I do value having a choice. There can be a real benefit in changing up the tools you use, for:
- Looking at things differently
- Creating new insights
- Keeping your team fresh
Sometimes, a new tool can help you understand something in a way your existing tool never could. Having just the right tool available to you can often help you get the job done faster and better.
Which is your favorite of these? Which are new to you? And most of all, what stakeholder analysis tools do you use that you suspect are not widely known? Please share them in the comments; I’d love to know.
Related Articles
Understanding Stakeholders’ Approach to Risk
How Can Organizations Address Conflicting Stakeholder Interests?
The Close Sibling of Communications and Stakeholder Management: Resource Management

Elevate your project management skills and propel your career forward with an MPUG Membership. Gain access to 500+ hours of PMI-accredited training, live events, and a vibrant online community. Watch a free lesson and see how MPUG can teach you to Master Projects for Unlimited Growth. JOIN NOW