As users of Microsoft Project, Project Online, or Project Server, you’ve probably been asked by your senior management for a visual overview of your project or portfolio so that they can understand the dates, statuses, and risks without unnecessary technical details. Traditionally, project managers have met such requests by manually reconstructing their project Gantt charts or timelines in PowerPoint.
The disadvantages to such manual project reporting are two-fold. First, recreating a project timeline or Gantt chart by hand in PowerPoint is both tedious and time-consuming. Once you’ve created your chart the first time, you’re signing yourself up for periodic updates, which means recreating that same visual over and over each time your project changes. Second, hand-built charts in PowerPoint can be inaccurate. Sometimes this is by mistake, and sometimes it is purposeful shading of reality. Either way, a chart with no footholds in the data won’t go far in convincing your stakeholders that it’s much more than a pretty picture.
OnePager Pro aims to solve both problems by providing understandable graphics comparable to PowerPoint, while firmly maintaining integrity with the underlying Microsoft Project plan(s), both initially and across all periodic updates.
OnePager Pro imports one or multiple project plans, is compatible with Microsoft Project (*.mpp files), Project Online, and Project Server, and gives users the ability to filter those projects so that only key tasks and milestones appear in the chart. Once the projects have been imported and the chart created, users have many options to customize the formatting and layout of their chart, before exporting to PowerPoint or PDF to share with their audience.
Here are a few of the key features that OnePager Pro provides in addition to what you get out of the box from Microsoft Project.
Choose from Multiple Layouts
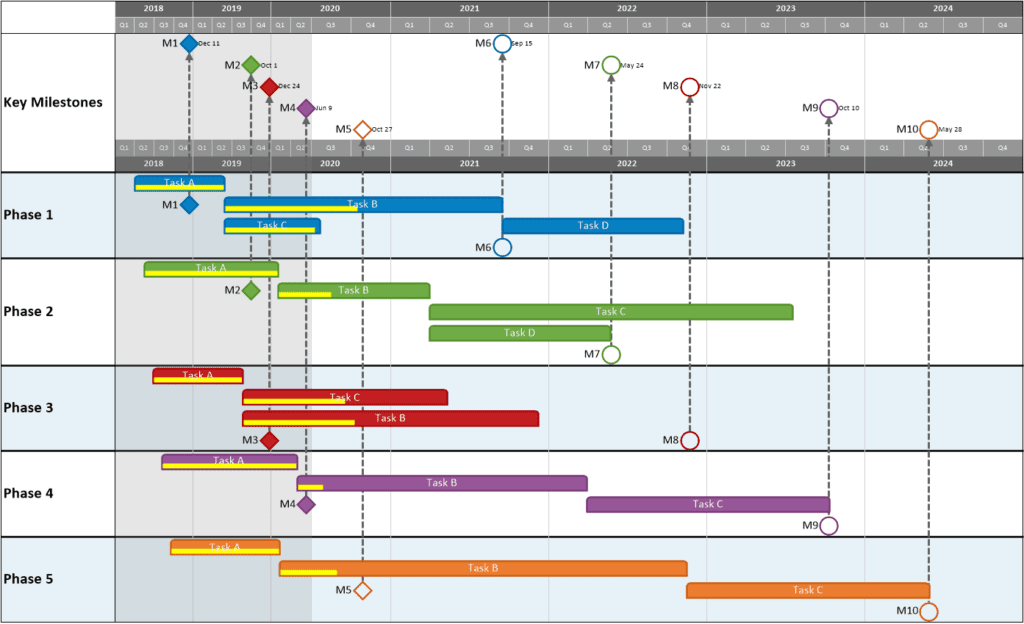
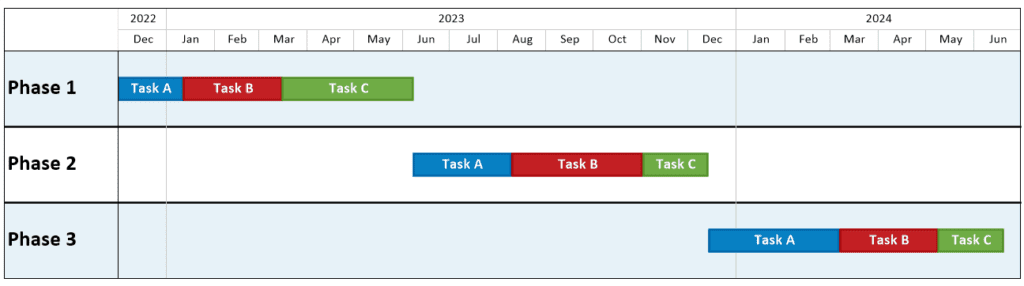
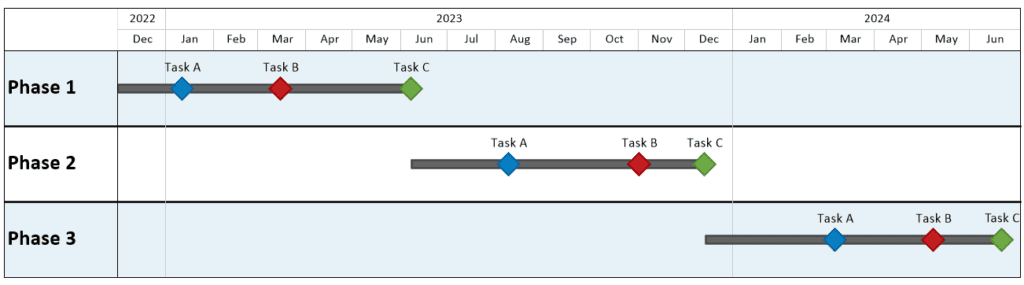
No two projects are the same. OnePager offers multiple layout options so that you can decide the best way to arrange your tasks and milestones in the chart. Below, we have the same project, displayed three different ways.
A Gantt Chart Layout places each task and milestone in its own row, creating a waterfall that cascades a project’s tasks from start to finish.
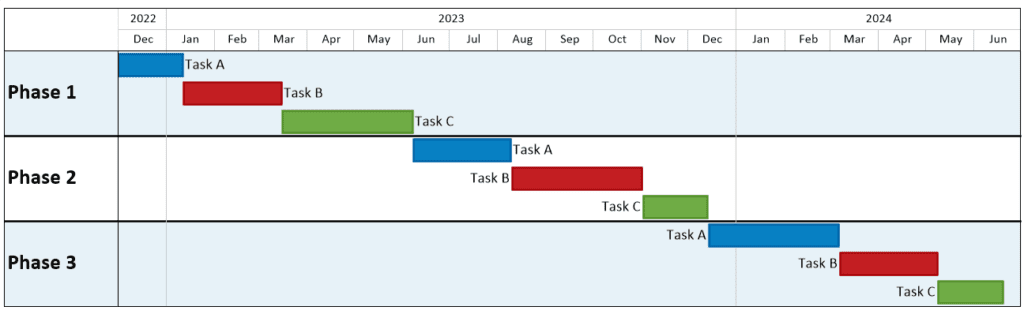
A Timeline Layout compresses the chart so that tasks are lined up left-to-right in sequence, typically when they share the same parent task, or are members of the same subproject. OnePager can create timeline layouts automatically based on the work-breakdown structure (WBS) that you’ve already established in Microsoft Project.
A Birds-on-a-Wire Layout is another flavor of a timeline layout, but trades tasks for milestones, so the audience focuses on delivery dates instead of durations. In this example, the parent tasks remain as a bar in the background, but all the other tasks have been switched to milestones linked to their finish dates.
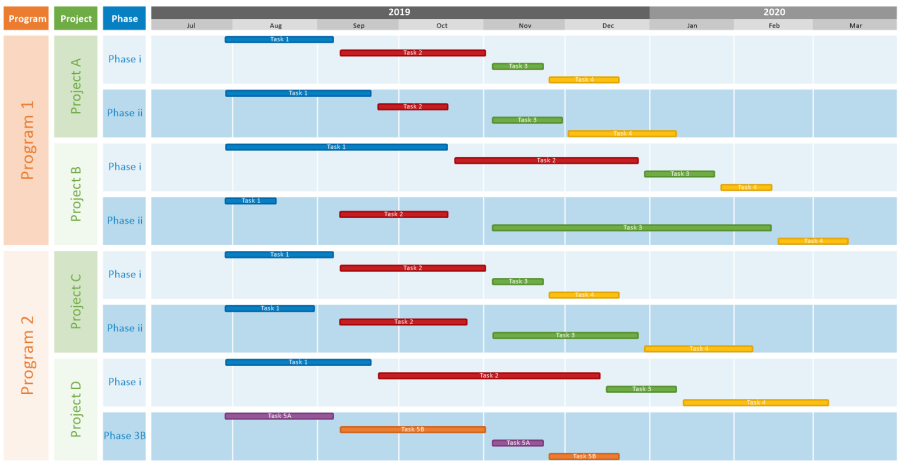
Group and Sort into Swimlanes
Swimlanes enable you to group and sort your tasks and milestones into sections based on any field that you already have set up in Microsoft Project. Typically, OnePager places tasks into swimlanes based on the WBS of the underlying Microsoft Project plan. But in practice, any field from Project, including enterprise custom fields from Project Online or Project Server, can define your swimlanes.
OnePager supports multiple levels of swimlanes, allowing you to group swimlanes first by one field, and then again into sub-swimlanes by other fields. In this example, we first group by project, then by program, and finally by phase.
Stylize your Chart with Conditional Formatting
Everyone loves reports with a splash of color, but it’s not just a matter of aesthetics. Color is one of the best ways to distinguish one set of related tasks from another, or to make certain tasks stand out. OnePager’s patented conditional formatting engine enables users to set up rules which automatically assign meaningful colors, based upon properties of each task. In this example, OnePager assigns color based on the status of each task in Microsoft Project.
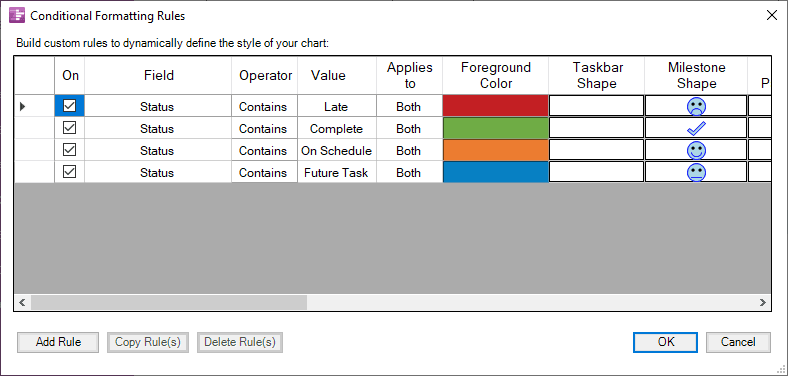
In addition to supporting rules that assign color, OnePager supports conditional formatting of the following task properties:
- Task shape
- Milestone shape
- Hash fill pattern
- Size
- Border
- Font
When users apply conditional formatting to their OnePager charts, those rules remain in effect through future updates. So, in the above example, if a task starts out as late and then becomes complete, it will automatically turn from red to green without the need for users to hand-paint colors, as they would in PowerPoint.
Display Key Project Details
Not all project reports require significant amounts of details— for some it is sufficient to just track key dates and status. But in cases where your audience needs to understand more than the basics, OnePager can pull in many other elements of your project and incorporate them into your chart, either graphically or as text.
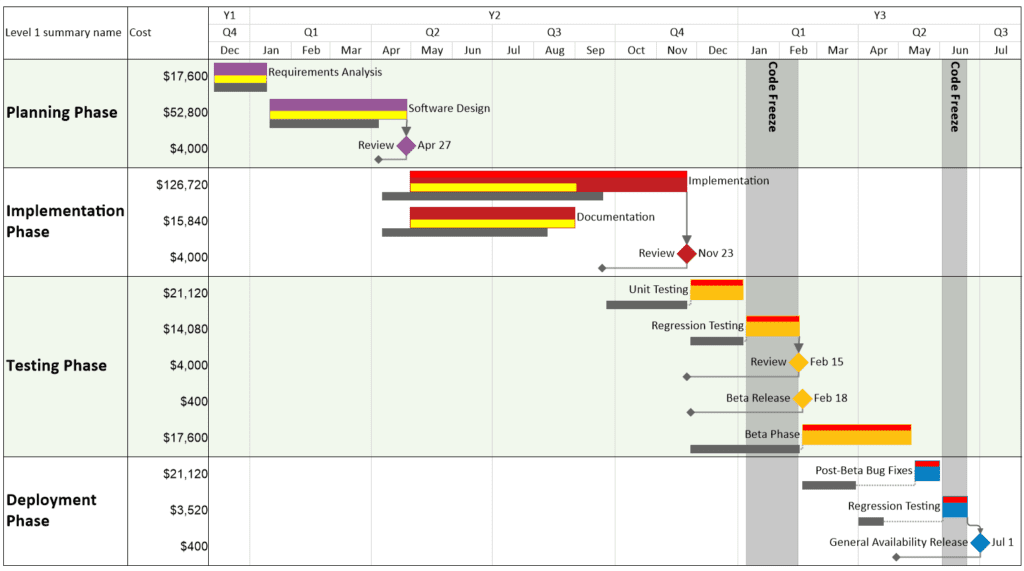
In the above example, OnePager displays the following “decorations”:
- Percent Complete is displayed as a yellow progress bar along the bottom of each task.
- Baselines appear underneath the primary tasks and milestones to visually track planned vs. actual.
- Tasks that are on the Critical Path display a red highlight along the top of the task bar.
- Dependencies show predecessor-successor relationships, which can be filtered to avoid information overload.
- Date Labels show specific dates for key milestones.
- Text Columns display any other project data that isn’t rendered graphically, such as cost.
Quickly Update and Track Changes
While it’s usually quick to set up a OnePager chart, you still don’t want to have to create a new one each time your project changes. OnePager offers a one-click refresh that will quickly pull your updated data from Project and refresh all the information in your chart.
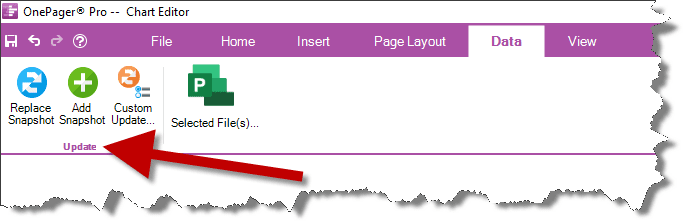
If you plan on conducting a post-mortem, or just need to understand how your project or portfolio has changed week-by-week or month-by-month, OnePager also offers the ability to take snapshots at specific points in time. As you refresh your chart, OnePager preserves the historical information about your project, enabling you to move backward and forward in time to visualize changes as they take place.
In this example, the statuses, finish dates, and costs are changing from snapshot to snapshot.
Standardize Reporting with Templates
Much in the same way that OnePager makes it easy to update the same chart as your project changes, templates allow you to create multiple charts that contain the same styles and rules. If you have a chart that you like, you can save it as a template. You can then use that template to create new charts from different projects that share the same rules, swimlane definitions, and graphical look and feel as the original chart. Better yet, you can share your template with your colleagues and enable them to create similar charts without the same amount of setup time.
Learn More
Whether you are a solo project manager, or part of an enterprise PMO, OnePager will help you simplify and standardize your reporting out of Microsoft Project, Project Server, or Project Online with graphically stunning, data-driven timelines and Gantt charts. MPUG readers are invited to take a free trial of OnePager Pro to see how it works with their own projects.