Schedule a demo of LiquidPlanner with a product expert today

Release 35 | November 22, 2022
This release provides a boost for effective time management with the introduction of a Work Limit for controlling hours put into projects and tasks. Whether you’re billing for time or managing scope creep, this feature keeps you on track. There’s also a new widget for Dashboards along with greater visibility for Dependencies and Schedule Limits in your plan. Catch the highlights below and learn more in the Academy.
New! Work Limit
Setting a Work Limit places a cap on the number of hours you should work on an item. Once the limit is set, Work Limit Delta shows how you’re tracking against it and risk alerts display when the limit is exceeded. Read more in the feature post about Work Limit.
NEW! Assignment List Widget for Dashboards
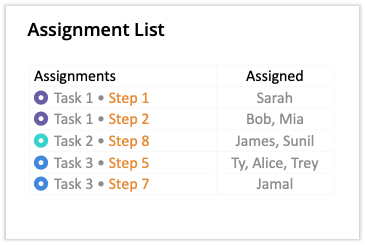
The new Assignment List widget is a fast follow up to the Dashboard release earlier this month. Plan Item List widgets are custom tables that you can design to display schedule data, work metrics and other properties on your dashboard. You choose the columns, their sort order and the number of rows to display. When viewers click on a list widget it expands into an interactive Grid View. There are five types of list widgets: Package, Project, Sub-Folder, Task – and now Assignments.
NEW: Assignment List Widget displays up to 5 columns and 20 assignment rows on the Dashboard. Default columns in the expanded Grid View are Assigned To, Total Work (Expected), Logged, Remaining Estimate (Expected), Cost Code, Expected Start, Expected Finish. Customize the widget display and expanded view in widget settings.
Learn more in the Academy: Widgets & Groups
NEW! More ways to visualize Dependencies
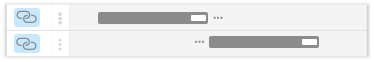
LiquidPlanner supports finish to start dependencies on all plan items: Packages, Projects, Sub-Folders, and Tasks. Items with dependencies are designated by the “Has Dependencies” icon. Clicking the icon opens the Edit Panel where all the dependencies related to that plan item are listed. To see how they look in the schedule we introduced dependency indicators on schedule bars so you can tell which plan items have predecessors and successors, or both!
NEW: Dependency indicators on schedule bars in Priority Views, the Predictive Schedule column in Grid View, the Dashboard Schedule Summary Widget, and on the Assignments table in the Task Edit Panel. Three dots after a schedule bar means there is a Successor dependency, three dots in front of a schedule bar means there is a Predecessor.
CHANGED: “Has Dependencies” icon is represented by a chain, showing that items are linked in a dependent relationship. Click on it to open the Edit Panel Scheduling tab and see the dependency list.
Learn more in the Academy: Dependencies & Wait Time
NEW! Schedule Limit icon
![]()
Scheduling Limits make it possible for people to work on multiple projects simultaneously because they can allocate how much time they should spend in various projects on a daily, weekly or monthly basis. Scheduling Limits can be set on Packages, Projects and Tasks. We got feedback about it being hard to tell whether or not a limit was applied so we added an icon to provide a visual cue.
NEW: Schedule Limit icon displays whenever a plan item has a Scheduling Limit set. It’s seen in every view including Dashboard List Widgets, Priority Views, Workload, Board and Grid Views. Click the icon to open the Edit Panel and view the Scheduling Limits table to see who has a limit, the type and the number of hours.
Learn more in the Academy: Scheduling Limits
Insights show where you need to take action
Everything you need to make decisions is in your workspace. Schedules adjust with every change, driving insights about progress, risk and workload that help you correct course and deliver projects with confidence. Schedule Insights are provided on the Edit Panel Scheduling tab for every plan item. They tell you when assignments need attention, explain what may be causing tasks to take longer than expected and help you manage target dates so you can deliver on time.
CHANGED: Insights has moved to the top of the Edit Panel Scheduling tab for greater visibility.
Learn more in the Academy: Projects, Tasks & Assignments
Add Multiple Tasks
Getting projects up and running as quickly as possible is very important for maintaining momentum in high performing teams. To speed up the process we reduced the number of steps it takes to Add Multiple Tasks. The grid has been expanded so you can include schedule directives, work metrics, task status and data fields from the very beginning instead of editing in a second step.
CHANGED: Add Multiple Tasks including the first assignment, along with Ranged Estimates, Work Limits, Task Status, Description, Target Dates, ASAP Scheduling, Assignment Scheduling, and Data Fields. Up to 50 tasks can be added from this location.
Learn more in the Academy: Tasks & Assignments
Risk Alerts
Predictive scheduling calculates in real time and as things change, Risk Alerts let you know when work is expected to go past a Target Finish and if Work Limits have been exceeded. Find out what’s going on by clicking the “Has Risk” icon and jump to the Edit Panel to investigate.
CHANGED: Alerting has expanded to include Work Limits in addition to Schedule Risk.
CHANGED: “At Risk” filters display items with Schedule Risk and those that have exceeded their Work Limit.
NEW: When a Work Limit is exceeded, the “Has Risk” icon appears in Work Limit and Work Limit Delta columns as well as all the columns for Logged, Remaining Estimate and Total Work hours.