Please find highlights from Ben Howard’s course – Automate your Project for the Web (P4W) and Project Online (PJO) Reporting – being provided by MPUG for the convenience of our members. You may wish to use this transcript for the purposes of self-paced learning, searching for specific information, and/or performing a quick review of webinar content. There may be exclusions, such as those steps included in product demonstrations, or there may be addition to expand on concepts. You may watch the on-demand recording of this webinar at your convenience.
Overview of Power BI
Power BI is a powerful visualization tool that allows you to transform data into interactive and meaningful insights. It is a data visualization and business intelligence tool that provides a wide range of features to help you create, publish and share interactive data-driven reports and dashboards.
Power BI consists of two components: the Power BI service, which is a web-based version that you can access via your tenant subscription, and the Power BI desktop client, which is a powerful data visualization tool that you can use to create and publish reports.
One of the key features of Power BI is the ability to create different workspaces, or areas, where you can publish reports. These workspaces can be used to organize and share different types of reports, such as HR reports or financial reports, with different levels of permissions.
How To Visualize Data From Project for the web With Power BI
One way to do this is by using Power BI apps, which are pre-configured reports that are provided by various third parties, including Microsoft. These apps allow you to easily connect to your Project Online site and view your data in a visual and interactive format.
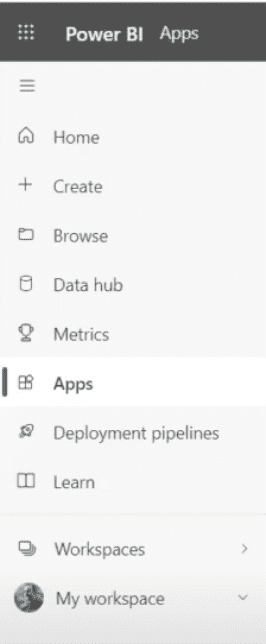
To get started, you will need to navigate to the Power BI apps tab on the left site and click on it, then click on the “Get Apps” button on the top right.
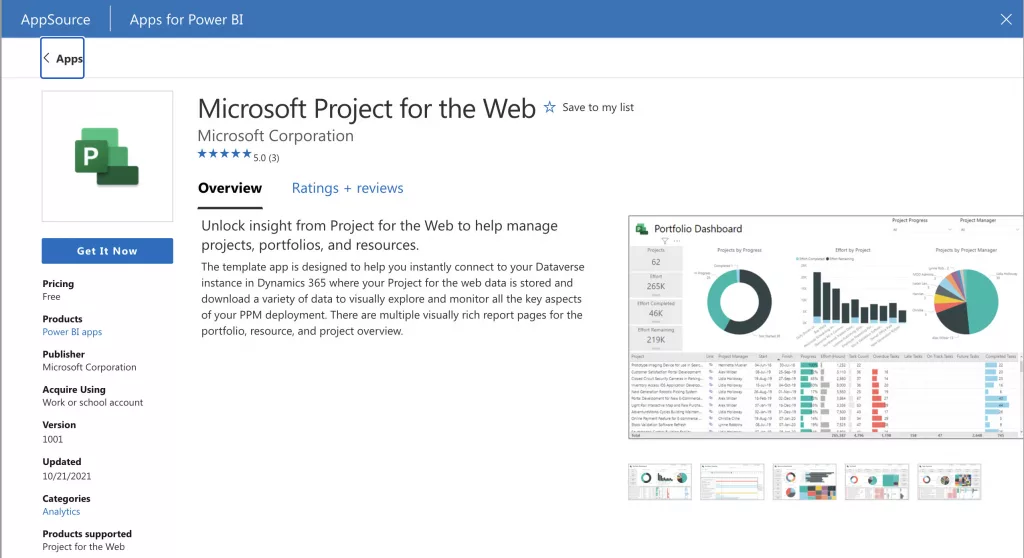
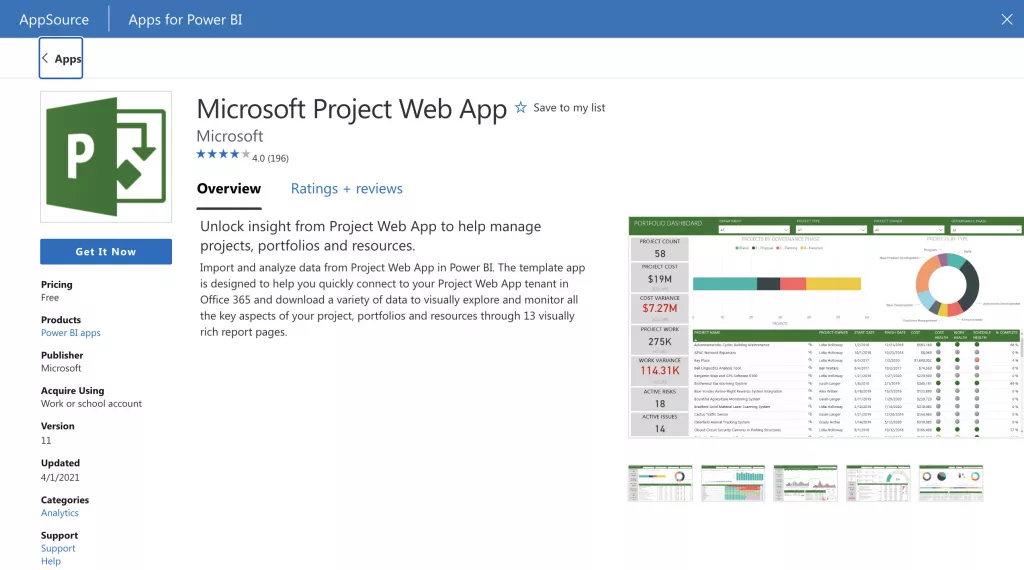
To find Microsoft Project you can search for Project in the search field. You will be prompted to confirm your identity and authorize the installation. You will also have to agree to the end-user license agreement.
Once the app is installed, you will have access to a pre-configured dashboard that provides an overview of your Project Online data. This dashboard can include visualizations such as Gantt charts, progress bars, and other types of data representation. By default, your dashboard will be pre filled with default data. You have to import your data.
Importing Your Data From Project for the web Into Power BI
To connect your data source to Power BI, click on the text “Connect Data”. This will open a prompt to add a link to your data source.
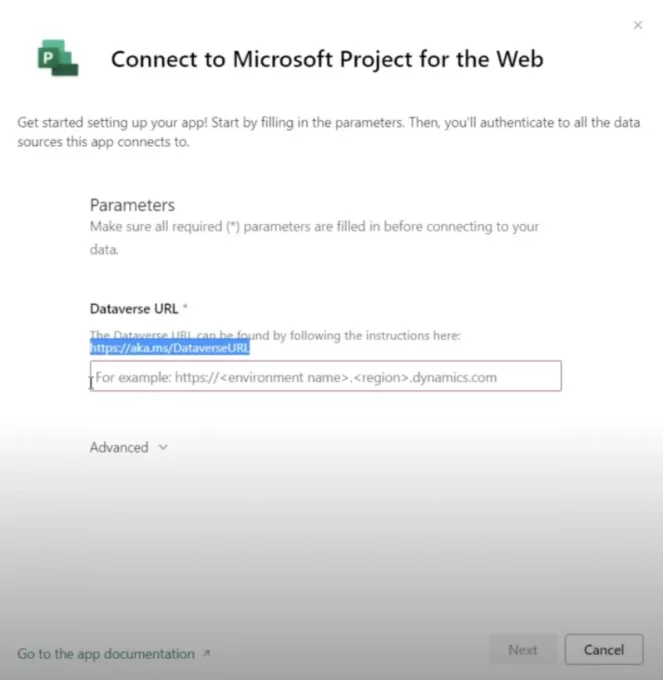
After providing the link, you will be prompted to authenticate your credentials. This will allow Power BI to access your data. Once authenticated, the app will begin to refresh the data in the background. This process may take a little while, depending on the size of your data.
Once the data has been imported, the app will enable you to see an overview of your projects and their progress, including the number of tasks, hours worked, and progress made. You can also see the number of overdue tasks, late tasks, future tasks, and completed tasks, giving you a clear picture of the status of your projects.
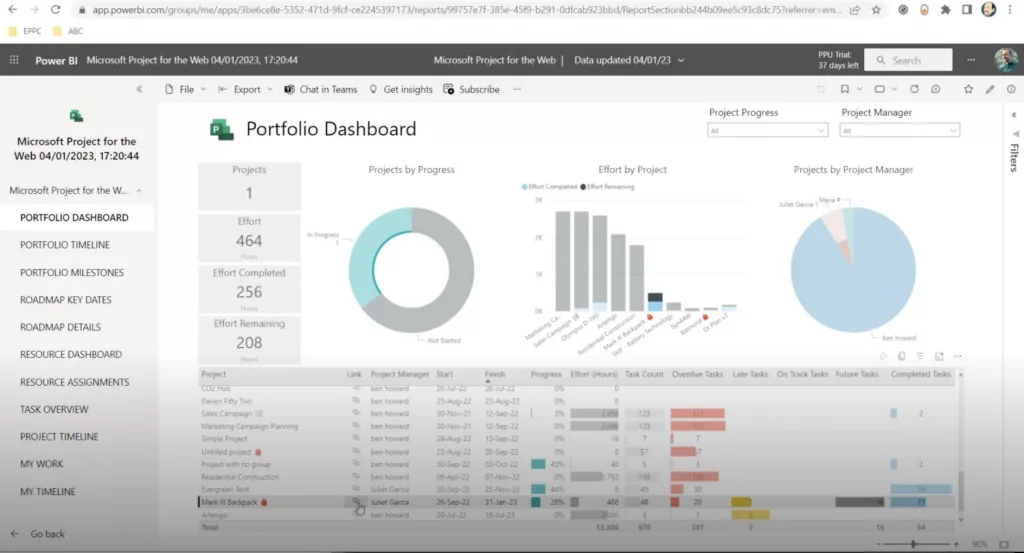
In addition, you can also filter and drill down into your data to get more detailed insights. For example, you can filter the data by project, task, or resource, to see how specific projects or tasks are progressing. You can also explore the data by drilling down into the visualizations, such as clicking on a project in a chart to see more detailed information about that project.
A key feature of this app is the level of interactivity it provides between Power BI and Project for the web. On the report, you will see a little link next to each project. If you click on this link, you will be taken directly to the timeline for that project in Project for the web, allowing you to manage your projects in real-time and making the workflow even more seamless.
Automating Your Project Online Reporting
To automate your Project Online reporting, you need to download the “Microsoft Project Web App” from the Power BI app list.
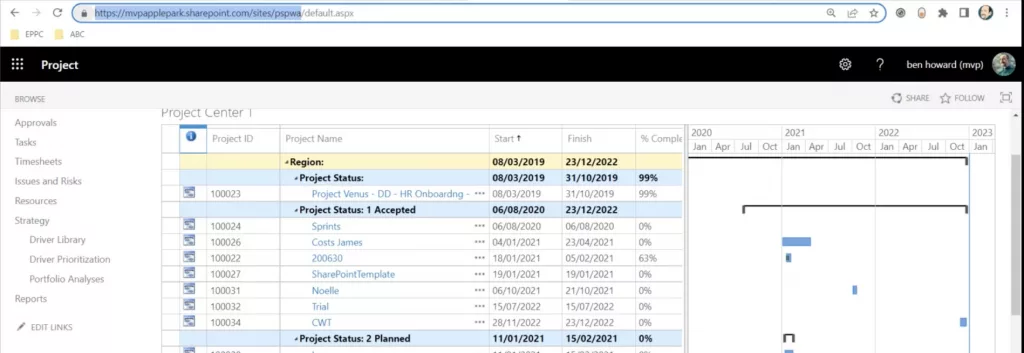
Once the app is installed, open it and click on the option “Connect Data.” This will open a prompt where you will need to provide the link to your Project Web App (PWA site URL). You can find this link in the URL tab in your Project Online instance.
After providing the link, you will be prompted to authenticate your credentials. This will allow Power BI to access your data.
The app is set to automatically refresh data every night, so you can be sure that your report is always up to date with the latest data. With this feature, you can automate your project online reporting and be sure that you always have the latest data to make informed decisions.
Explore the report. Once the data refresh is complete, the report will be populated with your own data.
Once you have connected your data source, you don’t have to manually update the report every day or week. Instead, changes you make in the respective app (Project for the web or Web App) is automatically updated in the background at the scheduled time, providing you with an up-to-date overview of your projects and their progress. This is a powerful feature that can save you a lot of time and effort and allow you to focus on what really matters – managing and tracking your projects.
Alternative Ways to Automate Reports
In addition to exporting to PowerPoint, there are other ways to automate your Project Online reporting. For example, you can schedule automatic email reports to be sent to specific individuals or teams. This can be done through Power BI’s built-in scheduling features, which allow you to set up automated reports to be sent at specific intervals, such as daily, weekly, or monthly.
Another option for automating your reporting is to use Power Automate, a service that allows you to automate workflows and tasks across different applications and services. With Power Automate, you can set up workflows that automatically update data in your Power BI reports and send notifications or alerts when certain conditions are met.
By automating your reporting with Power BI and connecting it to both Project Online and Project for the web, you have a complete view of your projects, including risks and issues, resource availability, and other important data. This can help you make better decisions and manage your projects more effectively. Additionally, by having everything in one place, you can save time and effort by not having to switch between different tools and platforms to access your data.
Customizing the Pre-defined Apps
The pre-defined apps make automating your project reports much easier. However, these apps are pre-defined by Microsoft and cannot be easily modified to match your organization’s branding.
To overcome this limitation, Microsoft has made the apps available on GitHub, allowing users to customize the templates to match their organization’s branding. Accessing the templates is easy. You simply need to go to GitHub.com, navigate to the Office Dev page, and search for “project-powerbi-templates”.
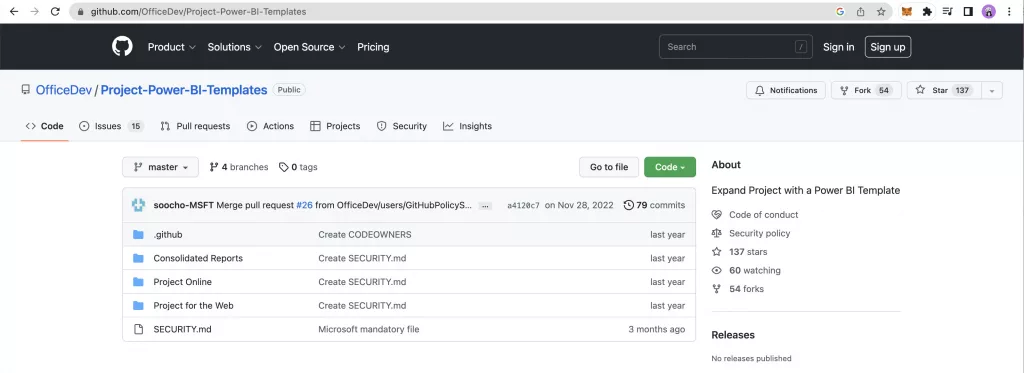
On the project-powerbi-templates page, you will find a variety of templates to choose from, including Project for the web, Projects Online, and one that brings both together. Each template provides a blank set of reports that need to be configured to match your specific needs. By using these templates, you can easily customize the look and feel of your reports to match your organization’s branding.
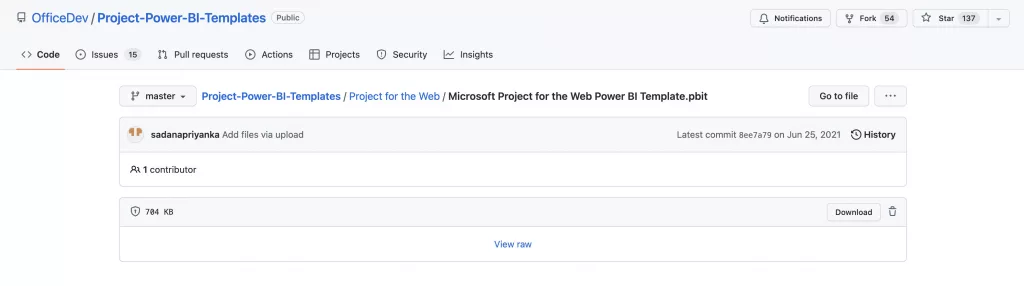
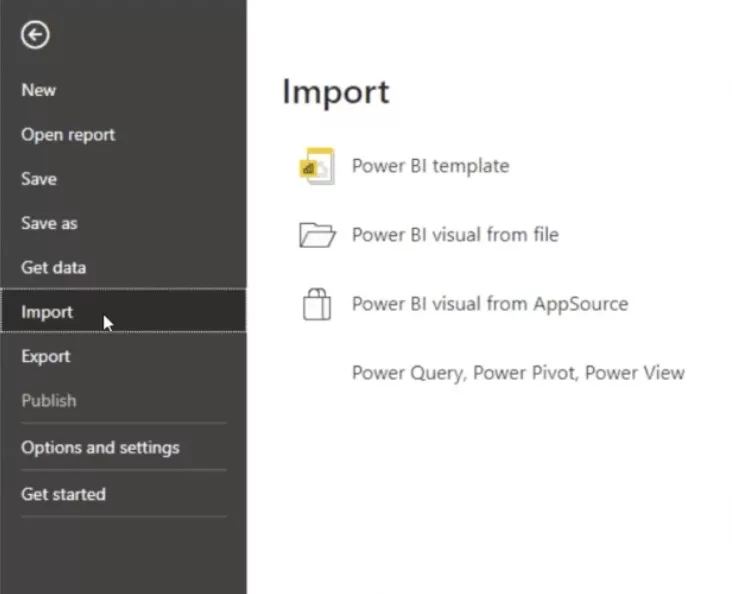
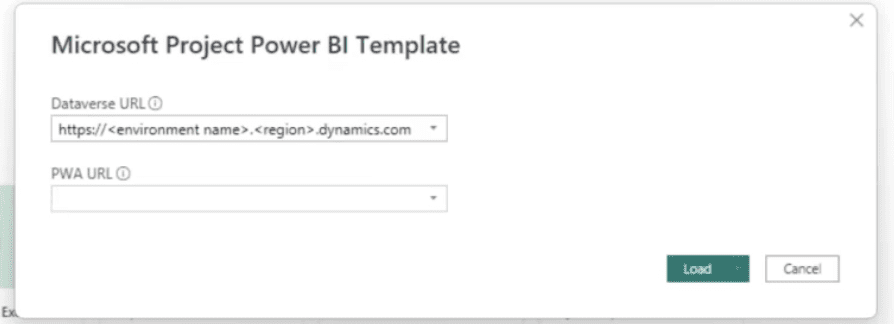
To use the templates, you will need to open the Power BI desktop application and import the template that you have downloaded from GitHub. Once the template is imported, you will be prompted to enter the URLs for Project for the web and Project Online. This will allow the template to bring in data from both sources, providing you with a consolidated view of your projects.
Once the URLs have been entered, you will need to click on the “Load” button to start the process of bringing in data. The data import process may take a while, depending on the size of your data. Once the data is imported, you will be able to customize the template to match your specific needs and start creating detailed and interactive reports.
Conclusion
In conclusion, automating your Project for the web and Project Online reporting can save time and streamline your workflow. By using Power BI, a powerful data visualization and business intelligence tool, you can easily connect to your Project Online site and view your data in a visual and interactive format. With the use of pre-configured reports, known as Power BI apps, you can quickly access an overview of your project data, including progress, tasks, and hours worked.