A Gantt chart is a stacked bar chart that displays a timeline of events and the associated tasks, milestones, or activities. Gantt charts are often used in project management to visually identify task and project start dates, durations, end dates, and more.
Gantt charts can be used on any size of project, whether big or small, or simple or complex. The size of your screen, printer, or patience will be the limiting factor in the usefulness of your chart.
Gantt charts are not at all new. In fact, charts of this type have been common practices among project leaders and people just “trying to get things done in an orderly way” since well before the Gantt chart.
Before the widespread use of the chart we know today, bar charts (very similar to Gantt charts, just not named) and scheduling practices have been used by project leaders since the beginning of time, dating back 3000+ years.
Bar charts can be used for multiple purposes, including those beyond project management. Any application that intends to show what has happened over time can be visualized using a bar chart, which is effectively what we consider in project management to be a Gantt chart.
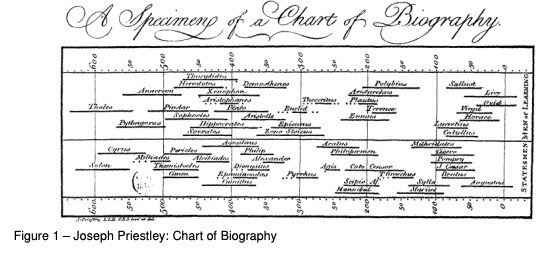
Consider this early example of a bar chart where Joseph Priestly charted the lifetimes of famous people on a bar chart. Just flip the lifetimes of famous people to tasks or activities in a project, and you’re well on your way to seeing the origin of what we now call the Gantt chart.
You are probably reading this article because you’ve been asked to create a Gantt chart, or you are looking for a way to visualize your project. Don’t worry; you are in the right place.
As a project manager myself, I have often used Gantt charts to quell the nerves of key stakeholders and help project teams visually see where we are now and where we need to go.
Gantt charts are a helpful visual, but they are not the project plan in itself. A Gantt chart is a visual representation of a project plan—it is not the whole plan.
Now that our history lesson is over, let’s get into it! This article covers the basics of creating a Gantt chart, provides some helpful tips, links to some of my favorite tools to use when creating a Gantt chart.
How To Create A Gantt Chart
It’s no secret that using an online software program makes creating a simple Gantt chart quick and painless (for the most part). Even if you’re hand drawing your chart (which I often recommend for new PMs), the steps to creating an effective Gantt chart are essentially the same.
First: Determine the Scope
The first step to creating a visual Gantt chart is to determine the scope of what you wish to display visually.
What I mean by this is:
- Are you looking to show a project portfolio where each project is one Gantt bar over time?
- Is your scope small, but you need to show all of the tasks?
- Maybe you wish to show one huge project with many workstreams, with each workstream containing multiple tasks.
Before you can expect to visualize the scope effectively, you must determine what it is you actually want to show.
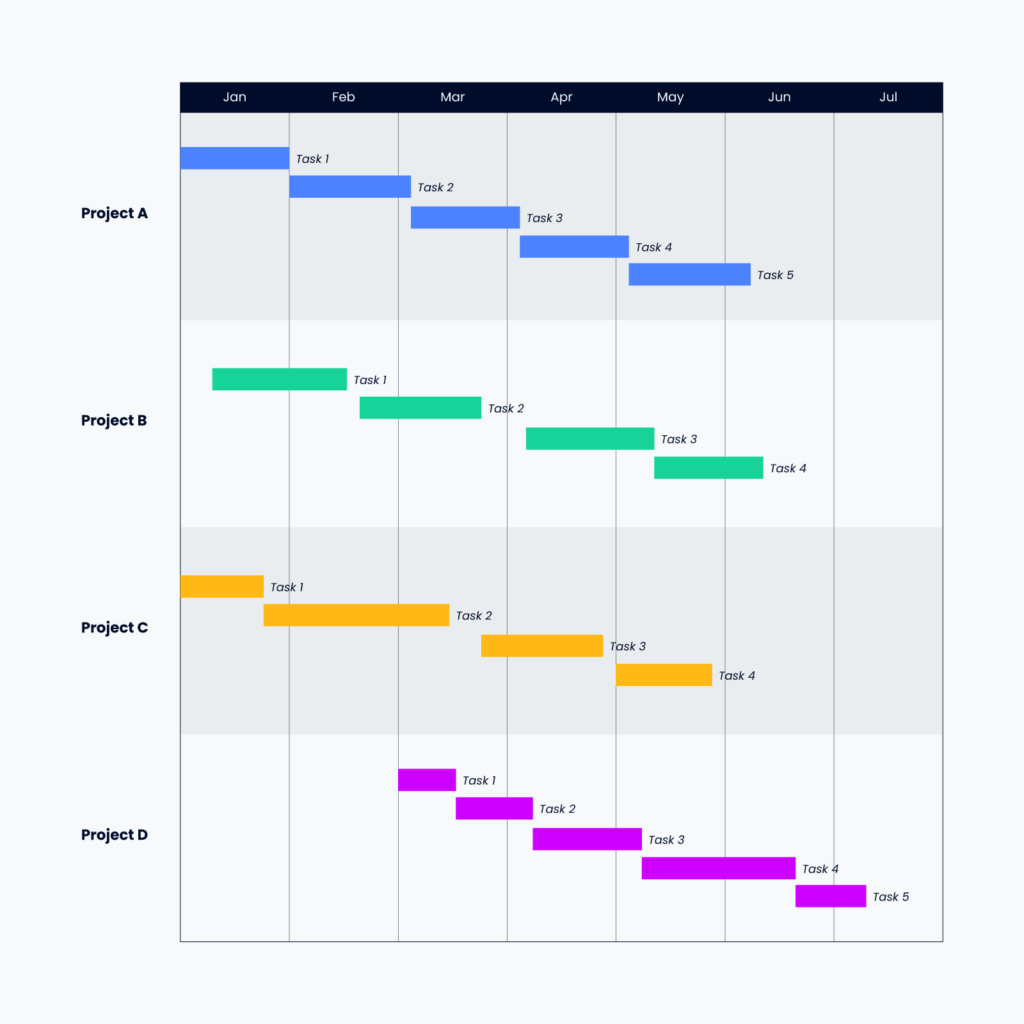
For example, you might show an entire project portfolio in a Gantt chart, with each project containing a few different phases (each which would then contain many tasks):
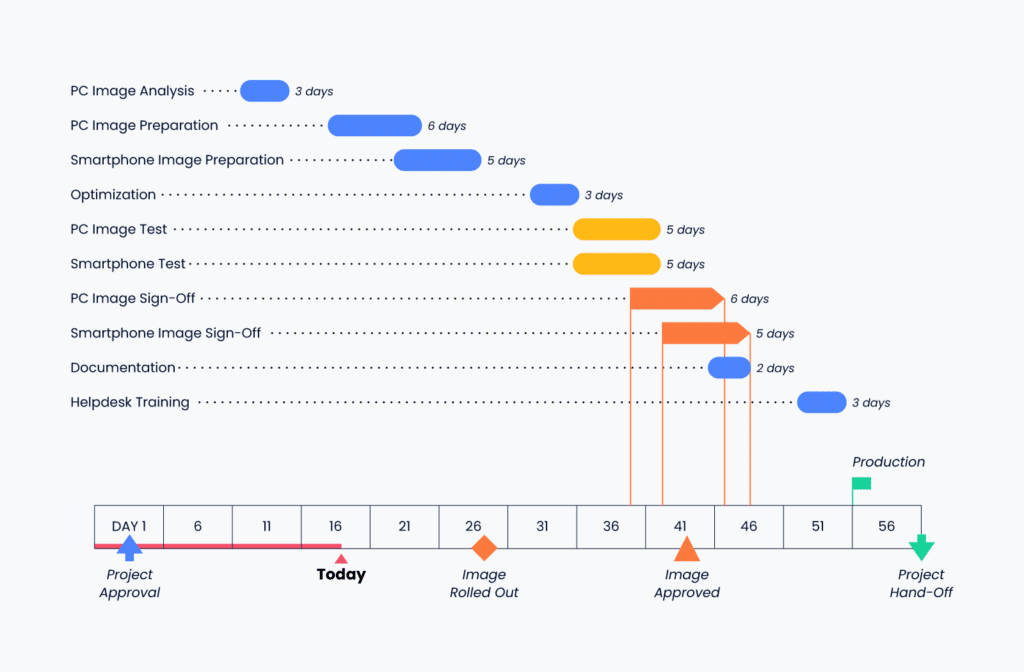
Alternatively, you could show a more detailed view, such as the steps identified in this project to create a new base image, or the basic install of OS and software within a company’s IT department:
Once your scope is determined, you need to identify the tasks and activities that fall within the scope of your desired Gantt chart.

Second: Identify Tasks and Activities in the Project
You need a list of all the tasks involved in your project and how much time each project task will take (at least an estimate). You might want to add the resources needed for that task and information about why a specific amount of time is required.
Some tasks are made up of smaller tasks or activities. That's ok! Capture as much information as you can about what needs to be done.
If multiple tasks can roll up to a larger task, consider if other tasks can also be combined, or whether it makes sense to change the “zoom level” of your Gantt chart into your project plan. There is no one right answer here, so just make sure that what you’re listing makes sense together.
For example, you wouldn’t show “plug-in the keyboard” and “open new data center” as tasks next to each other. Instead, you might roll up “plug-in the keyboard” into a larger task such as “install user interface hardware,” which would contain many sub-tasks or contributing tasks, including “plug-in the keyboard.”
You might end up fiddling with what I call the “zoom level” of your plan. Again, there is no one correct way, so choose whatever method will make the most sense for you, your project stakeholders, and the project team.
Learn more about what to include in your Gantt chart here.
Third: Sequence Tasks and Activities
Once you have a list of all the things that need to be done in your given project or Gantt chart scope, you need to sequence these activities and tasks into a thoughtful order and note any dependencies to identify the critical path.
Each task or activity must include an estimated start date, duration, and/or end date. With this information you can begin to thoughtfully order the tasks and see what comes next throughout the life of the initiative.
As you go along, be sure the schedule makes sense and isn’t jumping around too much. Items that are dependent on other items should be scheduled later than their predecessors.
Beware the Critical Path
A critical path is a component of the project schedule. It is the sequence of activities that must be completed on time to prevent the project from being delayed or even canceled.
The critical path represents the longest duration of time that a project can be delayed without losing the ability to achieve an overall targeted completion date for the project.
Critical path awareness is essential to developing a successful project management schedule and for successfully managing projects in general.
Critical path charts are commonly used in software development, accounting, engineering, construction, architecture, and many other industries that require keeping track of tasks with start deadlines or due dates.
Critical path analysis is not only used in project management. It can be used to manage workflows in organizations and for personal tasks.
It would be difficult to submit a term paper without reading the textbook and doing the research, which means that reading the textbook, research, and writing would be on the critical path to submitting the term paper.
You can’t skip the critical path items and expect to be successful in the end. First things first, and required things always!
Resource Constraints Influencing Timing
People and resources contributing to your initiative often have skills and experience you need to consider. Stay vigilant in identifying conflicts or times when you have a specialized resource over-committed!
A good way of working out what skills you need is by using a skill matrix. One way of doing this is to make a table and place all the skills that are required for the project in the top row. Then in the left-hand column, add all of those people or resources who have that skill.
Finally: Make It Visual
Once you have identified your scope, tasks and activities, dependencies, and general timing, it's time to make it visual!
If you’ve read my articles before, you know that I like to have folks start on paper and then make their way to software once the plan can be coherently described on paper—that advice stands true here as well!
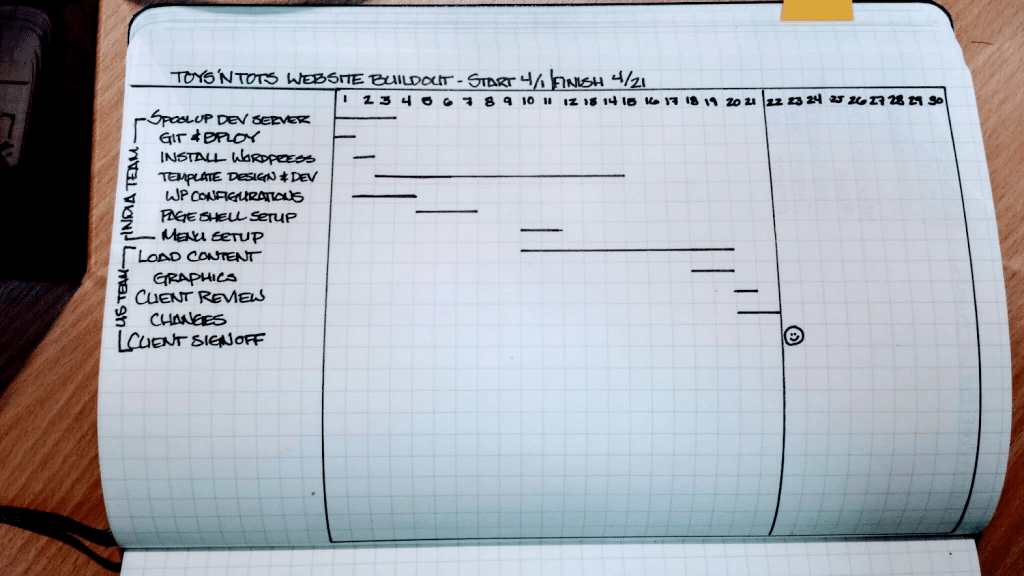
On paper: Start creating your Gantt chart on paper by listing all the tasks and activities you have in your scope on the left side of a piece of paper (landscape orientation). Next, draw a line across the top of the paper, not overlapping the task list denoting the beginning and end of the scoped project timeline. Then, for each task, draw a box or line at the appropriate spot in the timeline relating to each task.
If you try this method, you might uncover some unknown dependencies or tasks that are a little out of schedule alignment—that’s ok! That’s one of the reasons I recommend this method to start. Just make the change (hopefully, you used a pencil).
Finding these items earlier will help you be most successful when you finally digitize your Gantt chart.
On A Whiteboard: Create a sticky note for each task or activity in your Gantt chart scope. Next, on the whiteboard, draw a timeline across the top or middle of the board. Next, start to drop in your sticky notes where they make the most sense.
When I use this method, I often simplify my timescale by month or week at first, as many tasks need to be completed during that time. Once I drill down further, I can start sequencing the activities at a lower level of detail.
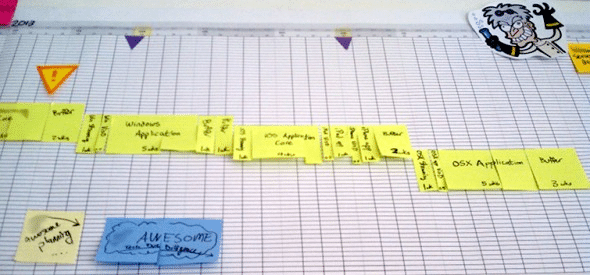
You might uncover some unknown dependencies or tasks with this method as well. Just make the change by moving the sticky notes around!
Once you have either drawn your Gantt chart out on paper or built a draft on a whiteboard, you now have my permission to use software to create the chart and revise it from here on out. If you’ve skipped this step, I understand. It's tempting to get going quickly.
What I would encourage you to do (since you’ve already ignored my primary guidance) is to go through each element of the chart and explain it to your colleague/cat/dog/house plants as if they have no idea what you’re talking about, but you need them to understand.
Start at the beginning and be detailed about what is to happen, what has to happen next, and why the items are sequenced the way that they are.
This practice will not only help you understand your project better, but it will also help you uncover hidden dependencies, opportunities to speed up, and risks to be aware of.
You may now proceed to use Gantt chart software.😊
What Is Gantt Chart Software?
Gantt charts can be created in many different software tools, all with pretty similar outputs but with varying planning features.
In essence, a Gantt chart tool or Gantt chart software takes your list of inputs for tasks or activities with start and end dates and builds a visually pleasing stacked bar chart just like the one you (hopefully) built on paper or on a whiteboard before attempting this step.
Learn about what Gantt chart software is here.
Benefits of Gantt Chart Software
Gantt charts are not difficult to create when you have a tool that is intended to create them. For example, in many online tools, task lists with dates can quickly switch between a variety of views (one of which is often a Gantt chart).
The use of online tools also typically helps with sharing your Gantt chart with interested parties—consider how you will share your plan as it is created and look for opportunities for stakeholders and team members to be able to self-serve or access the plan without having to ask you for it each time.
The software also typically includes plenty of Gantt chart templates, so starting a project is quick and easy.
Key Features of Gantt Chart Software
What are the most important features of Gantt chart software? Here’s what to look for:
- Customizability: The chart should be fully editable and customizable. It must include color-coding capabilities, as well as the ability to add, edit, and customize task names, descriptions, and milestones. The ability to add notes to tasks and dependencies is also a plus.
- Shareability: It should have an export function and other sharing capabilities, as well as collaboration features that enable simultaneous editing by multiple people. Sometimes, an executive wants to see the Gantt chart on a slide. Be ready to make that happen.
- Tracking: It should allow you to track tasks across milestones, statuses, durations, and projects.
- Formatting: It should provide conditional formatting, including highlighted rows and columns and formatting based on dates (highlighting late or almost-late tasks).
- Integrations: It should allow the Gantt chart tool to integrate with other software your company uses to accomplish projects (ex., Microsoft Project, Jira, SmartSheet, Trello, Asana, Monday, ClickUp, etc). Compatibility with Microsoft Office and Google Docs is also a plus.
- Mobile Accessibility: The Gantt chart tool must have a way to access the tool from a mobile device so you can feel confident that the critical information about your project is readily available, even if you’re asked for a copy of the chart during a “working lunch.”
Pro Tip: Most project management and Gantt chart software includes a free trial or freemium that is free for some features or team sizes. Take a look at what’s available and what offers the features that meet your needs. As always, if you’re new to an organization, ask what tools have been used there historically to see if there’s an existing tool that meets your needs before looking to introduce something new.
How to Build a Gantt Chart in Excel or Google Sheets
While it's great to use project management software to create a Gantt chart, sometimes we don’t have the tools we need to do what we want to do (approvals, budgets, etc.). When those moments come, I typically look to the tools I already have to make it work. That leads me to Excel and Google Sheets.
Both Excel and Google Sheets can be used to make simple Gantt charts. The goal of creating a Gantt chart in Excel or Google Sheets is simply to visualize a data table.
In most cases, fancy features, such as identifying bottlenecks, periods of wasted time, or task dependency complications, are not present. If you need those advanced features, you’ll want to invest in a project management tool.
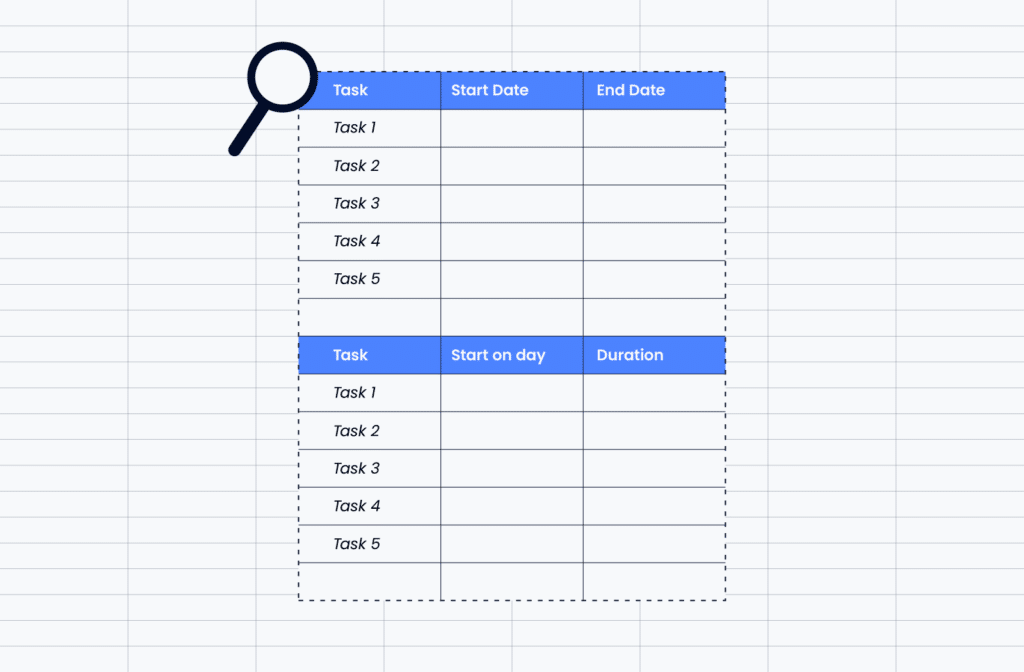
To get started in Excel or Google Sheets, you will need to first create a table with 3 columns, one each for task name (or activity name), start date, and end date. If you don’t already have a start and end date, you could use start date and duration as an estimate where start date + duration = end date.
You can also add a column for dependencies if you like. Dependencies are really where project management tools add more value than Excel or Google Sheets because there is logic built in to determine how changes in schedule impact other things. In Excel and Google sheets, we can only visualize the timeline as defined.
Once you have your tasks outlined, it's time to make your chart. A Gantt chart is effectively a stacked bar chart. Next, it's time to make it visual with the help of our friends at TeamGantt:
- Learn how to make a simple Excel Gantt Chart
- Learn how to make a simple Gantt Chart in Google Sheets
PS: Want to make a Gantt chart in Jira? Read our tips and workarounds for Jira Gantt charts here.
Get Started Creating Gantt Charts
So why is a Gantt chart tool useful? Mainly because it is visual! Gantt chart tools and software also make it easy to see which tasks have other task dependencies. No matter what you’re using to make your simple Gantt chart, the Gantt chart is only as good as the information in it.
If your plan is to go online and research Gantt chart software options, make sure to find a project management tool that offers the flexibility your company needs.
There’s a learning curve, but once you get the hang of it, a Gantt chart is an excellent way to keep your projects organized.
Start with our lists of Gantt chart software here:
Next, when you’ve picked a tool, or you’re looking to learn more, be sure to subscribe to The Digital Project Manager to stay up-to-date on all emerging trends in project management.