The value stream mapping method allows you to produce precise representations for each phase of your work process. It displays the movement of goods throughout your firm between the client and the supplier.
All elements are included in software solutions, an example of what a software firm may provide its clients.
The value stream map depicts the stages required to deliver value in your work process. This allows you to examine the status of each assignment and task in your team's effort.
It is critical to understand that Lean value does not include the price the client would pay. Although specific processes in mapping a Lean value stream may not immediately benefit the consumer, they can assist in guaranteeing that the end product or service is provided.
Quality checks are one such example. They are essential at every stage of manufacturing. Your consumer may not pay for these inspections, but if the product satisfies their standards or expectations, they will be able to buy from you again.
Read More: 11 Tips for Value Stream Identification
Value Stream Map (VSM): 10 Easy Steps
The Value Stream Map is one of the most effective tools in the Lean Toolbox. You can successfully convey where the emphasis of your Continuous Improvement activities will have the most significant impact in a short period (typically less than an hour).
The Value Stream Map is filled with images and friendly symbols, making it an easy tool to grasp and build.
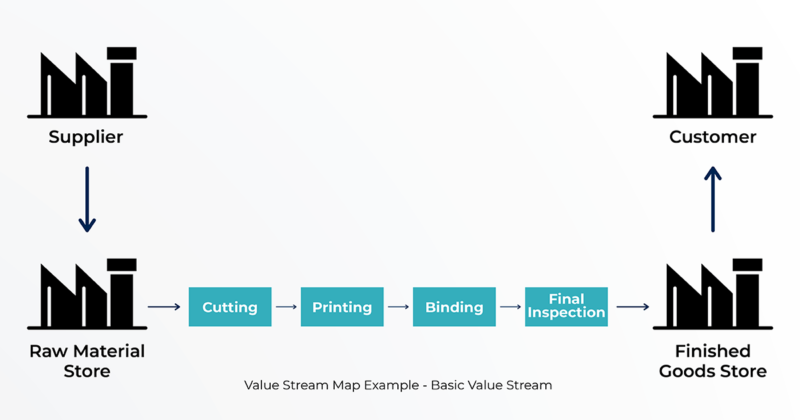
Using a printing and binding operation as an example, here is a Value Stream Map.
Step 1 – Analyze the value.
Understanding the concept of "value-adding activities" is essential before developing a Value Stream Map. Value-Adding Activities must meet the following criteria:
- It's what the customer wants.
- Materials or information are being processed or transformed into final products.
- When it's done right, it's done right.
Step 2 – What is our Focus?
The first thing to clarify when developing a Value Stream Map is that many teams erroneously think they are defining their focus.
A Value Stream Map is not a flowchart of a process. This is because a Value Stream Map does not monitor every possible path the process can take.
A Value Stream Map follows one part, service, or transaction through the process or a family of parts, services, or transactions. We simply keep track of one "value stream" route.
Step 3 – Go to Gemba (Walk the Process)
Many teams draw a VSM in a room far from the process they attempt to enhance. Worse, they create a VSM based on reports and SME accounts without actually going through the process themselves.
Step 4 – Work Backwards
The most challenging aspect of creating a VSM is not turning it into a flowchart that tracks all of the process's numerous pathways. There is a way to prevent making that mistake... Begin after the procedure and work your way backward.
When working backward from the end consumer, you have no option but to track that "one item."
Step 5 – Define the Basic Value of Stream
We define the basic steps in the value stream based on data collected from "going to Gemba" and SMEs.
Step 6 – Fill out the queue times.
We fill in Waiting (Queue) Times between each process once we describe the main stages in the value stream.
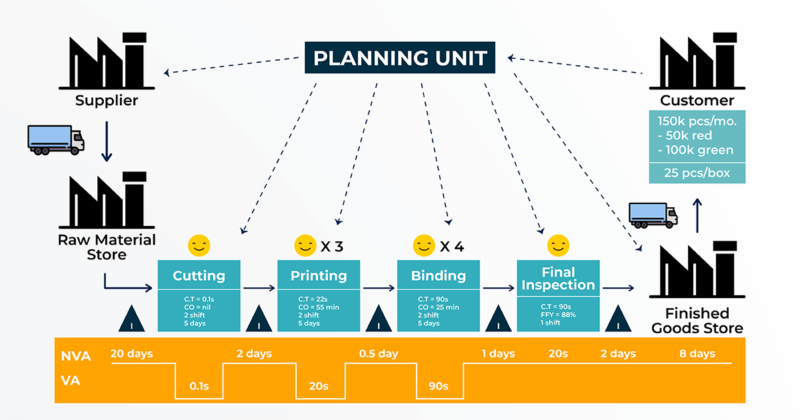
Step 7 – Input the process data
Add all relevant process data in the boxes below each primary process step box (starting with step #5).
Examples of Process Data:
- Process Cycle Time
- Changeover Time
- Pace / TAKT Time / Rate
- Defects / Problems Per Day
- First Pass Yield
- Batch Size
- Shifts
The team and you can define any data important to the process.
Step 8 – Include Smiley Faces
It is critical to determine the worker capacity at each phase. When creating the VSM, you may notice a bottleneck due to a labor imbalance.
Add a smiling face to each process box to indicate the number of laborers in the process at the time the value stream was taken.
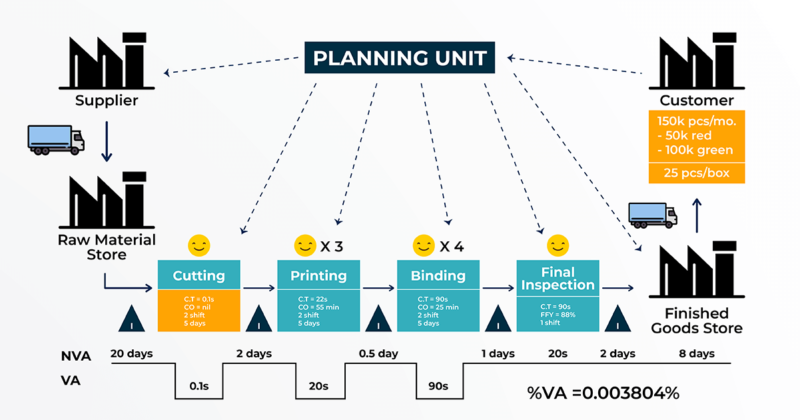
Step 9 – Include the Value-Added Percentage (%VA)
Add all of the data in the VA section and divide it by the overall process cycle time (the time it takes for the product or product family to travel through the entire value stream).
Multiply the resulting number by 100 to get the percentage (%). This yields the %VA (Percentage of Value Added Activities).
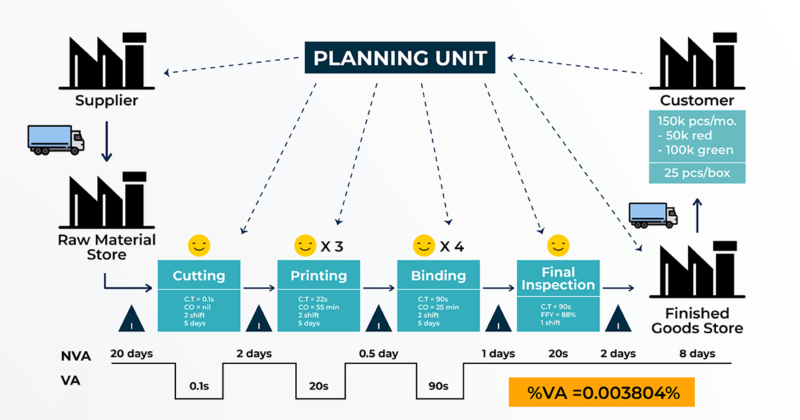
Step 10 – Interpret the Value Stream Map (VSM)
As a result, the VSM should now be a very pictorial representation of the process and what's happened to the product or family.
- Bottlenecks / Constraints
- Long Process Cycle Times
- Poor Uptimes
- Excessive Setup Times
- Poor Quality / Rework
The VSM should help build a roadmap for continuous improvement projects to get your process to the desired state.
Find Our Upcoming Training