If you have ever looked at a Gantt chart and thought to yourself ‘that’s not my cup of tea’, then think again because nTask can change that for you. We are here to answer everything you need to know about Gantt charts and how to make a Gantt chart using nTask.
How to make a Gantt chart in nTask? How to add tasks in a Gantt chart? How to determine task dependencies? What about planned and actual dates? and everything else you need to know.
In this post, we will guide you through the process and provide step-by-step details to make sure you get it right the first time.
Creating A Gantt Chart
Creating a Gantt chart using project management software might seem like a daunting task but with nTask you can say goodbye to your worries and say welcome to new ways of managing your workflows and accomplishing your goals.
Before we dive into the details of nTask’s Manager and how to use nTask to create a Gantt chart, we would like to give you a brief intro to the tool and the outstanding features that it offers for its users.
nTask – The Perfect Project Management Solution
nTask is a project management tool designed to help individuals and teams manage their projects without any trouble. In the short while that it has been introduced to the public, nTask has garnered positive reviews from almost all of its users.
The software now helps 250,000+ teams from over 150 countries all around the world manage their projects efficiently. nTask is a robust project management software offering seven different management solutions for the various processes that go on in an organization.
These seven management modules are:
- Project management
- Task management
- Time tracking and timesheets
- Risk management
- Team management
- Issue tracking
- Meeting management
In addition to the management solutions, nTask provides visual tools so that teams can stay up to date with the latest developments in a project and keep up with the process. nTask Gantt charts and Kanban boards offer a big picture of the project in process.
On top of that, the project management tool has an incredibly friendly interface that makes the onboarding process a walk in the park. Adding to its features are its iOS and Android mobile applications and two-factor authentication security.
Lastly, nTask’s pricing plans are also noteworthy considering it is one of the most affordable software out there in the market. It offers a free plan with limited features for its individual users. However, a priced plan with advanced features is quite inexpensive as well, starting at just $3 per month.
nTask Gantt Charts
nTask’s Gantt charts are one-of-a-kind offering efficient features to help you plan, manage and visualize your projects. Some of the most promising features include:
- Create tasks and add assignees
- Plan and manage workflows from start to finish
- Full visibility on the workflows
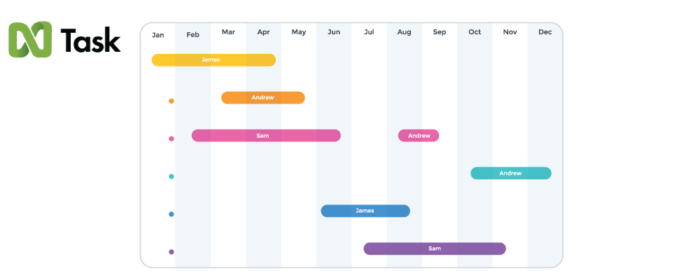
- Set milestones, planned and actual start and end dates, and add task dependencies
- Set budget and track expenditure
- Set priority status
- Create risks and issues and assign resources
- Integrate hundreds of apps and tools
- Identify critical path
- Organize and manage all your documents in one place
- Share your Gantt chart via a direct link or email
With all of these features, nTask can take tons of stress off your mind. All you have to do it to create your own Gantt chart on nTask and enjoy the benefits it brings to your team.
Read the following section to learn how to create a Gantt chart with nTask.

-
Develop next big thing with nTask.
Manage tasks, resources, documents, projects and timesheets easily. Sign up today!
- Get Started for Free
How To Make A Gantt Chart With nTask’s Project Manager?
How to create a Gantt Chart with nTask? So far, we have given you an overview of the tool itself and the features of its Gantt charts. This section is dedicated to the making of Gantt charts in nTask and as we mentioned earlier, the process is simple and easy.
Follow the following steps to create a Gantt chart for your team.
1. Create A Project
The first step in the creation of a Gantt chart is to add a project. You will have to assign a unique ID and project title to your project.
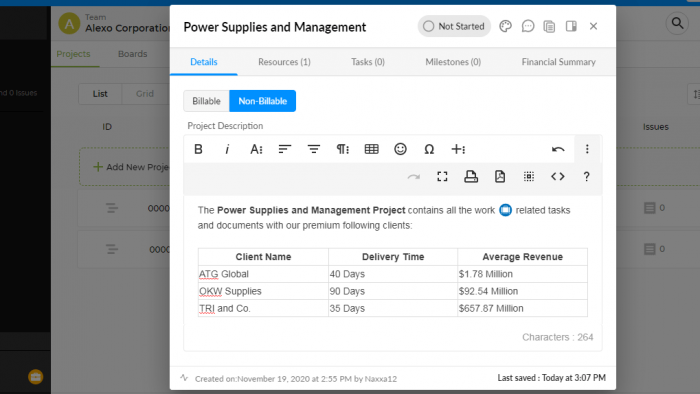
2. Add Tasks and Task Details
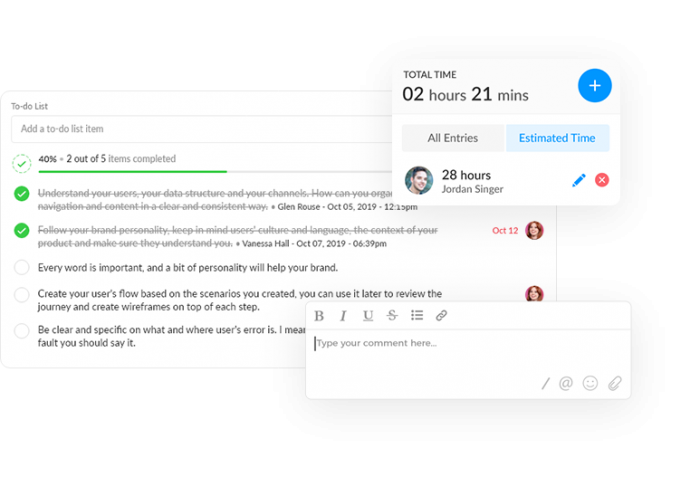
Once everything is set in place, you can start adding tasks to the workflow. You can either add a task with the title of the task or set a milestone with its title, planned date, and description. Once you have created a task, you can make it as specific as you like by adding all the details. You can add a task description, to-do list as well as set a priority status for the task.
You can also improvise your Gantt chart by adding custom fields that suit your business needs.
3. Set Planned and Actual Start and End Dates
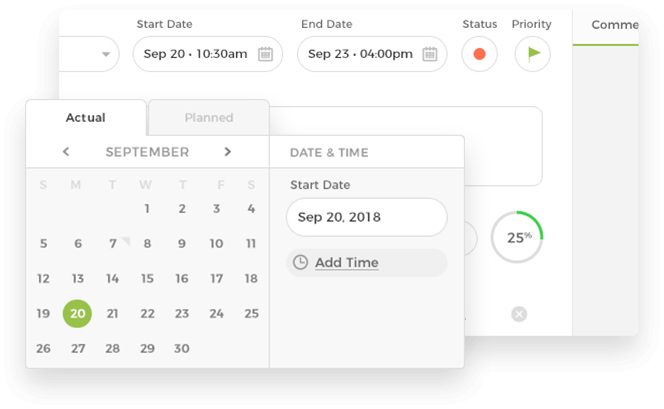
One of the biggest perks of using nTask is that it helps you gauge your performance by allowing you to set planned and actual start and end dates. This allows you to keep an eye on the deadlines and see if you have met them or not.
The results can also indicate your productivity and efficiency in completing tasks.
4. Assign Resources
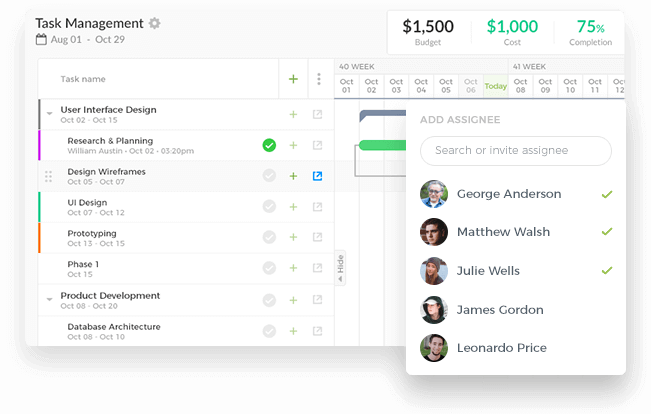
Once you have created tasks and added relevant details, you can start assigning the tasks to the available resources. You can choose an assignee from your team or add a new assignee via their email address.
5. Task Status
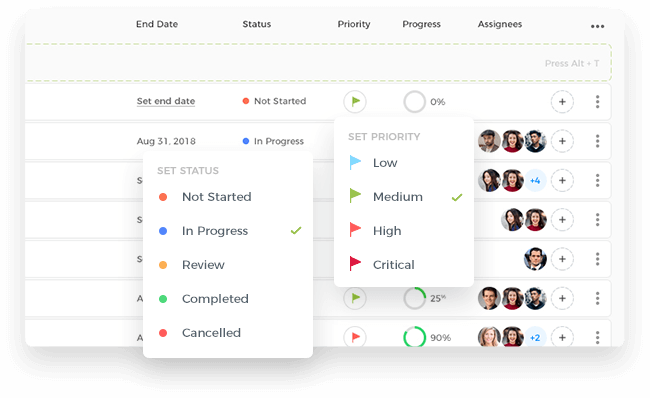
You can also assign task status to keep tabs on the progress of a task. There are five different options to choose from that let you know the status of the task. All the options are also color-coded to make it easy for you to identify the status at a single glance:
- Not started (orange)
- In progress (blue)
- Completed (green)
- In review (yellow)
- Canceled (red)
With color-coded bars, you can easily identify the status of a task.
6. Task Dependencies
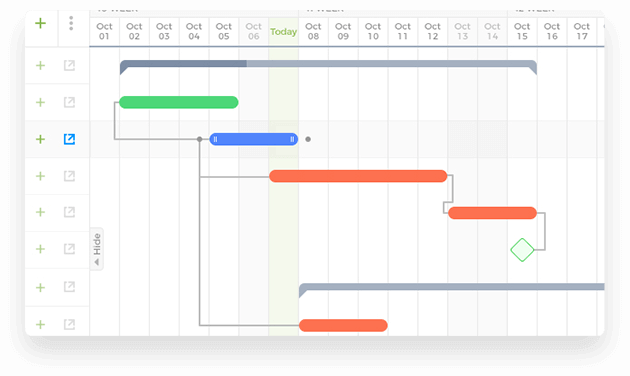
Creating task dependencies with nTask is also a piece of cake. You can set four types of dependencies for your tasks:
- Start to start
- Start to end
- End to end
- End to start
You can easily set task dependencies by connecting the tasks with other tasks, tasks with milestones, or milestones with other milestones.
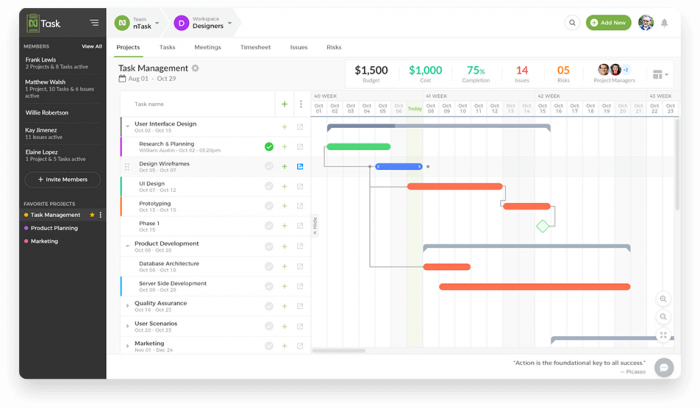
7. Project Summary
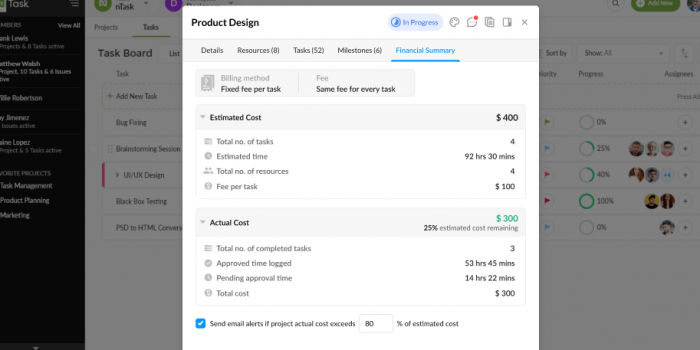
nTask’s Gantt chart displays the project summary including details such as project budget, project cost, completion percentage, issues, risks, as well as the manager of the project, helping you view all the details at a single glance.
8. Drag And Drop Functionality
One of the greatest perks of using nTask is the ease of use. With a simple drag and drop functionality, you can move bars and change the actual and planned dates. You can also drag the bars to expand the duration of completion of a task.
9. Customer Support
If you encounter any difficulty while creating a Gantt chart of your own or have any queries in mind, you can contact nTask’s customer support. Our customer support team members will guide you through the process and provide you with all the help you may need.
Benefits Of Using nTask’s Gantt Charts
While you might question our judgment since its product, we would like to assure you that our bias stems from the efficient functionality of our product. The step-by-step process we just explained must have given you an idea of how easy it is to work with nTask.
In addition, nTask Gantt charts have several other promising benefits that make it simply irresistible:
- Transparency: nTask makes it easy for all the stakeholders to track the progress in real-time, making sure that everyone is on board and on the same page.
- Simplify Complex Data: Gantt charts effectively summarize all the complex data of your project and present it in a simpler, readily understandable manner.
- Improves Productivity: With performance data insight, you can easily gauge the productivity of your team and identify the issues, if any, and resolve them for the future.
Conclusion
Want to speed up your work and improve productivity with minimal effort? nTask is the answer to your wishes.
Now that you know how to create a Gantt chart, create your next Gantt chart with nTask now and enjoy the smooth ride. And if you have any questions, do not hesitate, and ask us here right away.
Additional Resources:


