Project creates, program guides, portfolio decides.
– Quote from the book, “I Want To Be A PfMP – The Plain and Simple Way To Be a PfMP”
Project is all about deliverables and it creates a unique product, service, or result. Program is all about getting benefits by coordinating the components within its scope. Portfolio, on the other hand, is about meeting the strategic business objectives of an organization with a collection of the right portfolio components. Hence, it decides.
It’s Portfolio that decides which component Projects and Programs should take and which ones to drop. At the portfolio level, you not only authorize the components but also can deactivate or even terminate a component. Most important of all, it’s Portfolio which directly links the organizational strategy to a prioritized set of programs, projects, and operations. Portfolio is completely strategic in nature, whereas programs and projects are typically tactical. This is because, with portfolios, an organization achieves its strategic goals and objectives, which are outlined in the organization’s strategic plan.
By this time, the importance of portfolios and portfolio management is becoming clear. It’s key to have consistent success for an organization, deliver predictably, and remain ahead of the curve.
Now, to successfully enable the portfolio manager and hence, C-suite executives, a widely used artifact or key deliverable is the portfolio roadmap. In this article, we will learn more about portfolio roadmaps, and how to build such a roadmap with MS Project software.
Portfolio Roadmap
Let’s start with the definition of the portfolio roadmap. As per Project Management Institute (PMI®):
Portfolio roadmap is a document that provides high-level strategic direction and portfolio information in a chronological fashion for portfolio management and ensures dependencies within the portfolio are established and evaluated.
Illustrating further on the above definition, you can say the following about the portfolio roadmap:
- Graphically shows all the portfolio components (elements) to achieve organizational strategy and objectives.
- Provides a high-level plan for your portfolio, based on which low-level details will be prepared. The low-level details include the low-level schedule and timeline of portfolio components such as projects, programs, operations, or other work.
- Provides the foundation or initial basis on which internal and external dependencies are established and evaluated.
A portfolio roadmap is crucial because it shows the strategic intent of the organization in a visual (graphical) way. Irrespective of the approach used in portfolio management such as predictive (waterfall), adaptive (agile), hybrid, or any other, the roadmap acts as an information radiator.
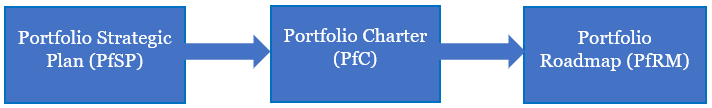
From Portfolio Strategic Plan to Portfolio Roadmap
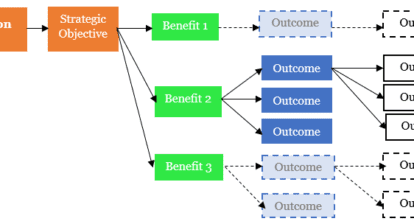
The significance of a portfolio roadmap is further emphasized in the flow of processes in portfolio management. A portfolio primarily exists to achieve the strategic business objectives of an organization. The vision, goals, strategies, and objectives of a portfolio are listed in the Portfolio Strategic Plan (PfSP), which is created during the Develop Portfolio Strategic Plan process. The PfSP drives the development of the Portfolio Charter (PfC), created in the Develop Portfolio Charter process. The PfC links the portfolio to organizational strategy and formally authorizes the portfolio and portfolio structure. Next, PfC drives the development of the Portfolio Roadmap (PfRM), which is created with the Define Portfolio Roadmap process. With the PfRM, the portfolio structure is visualized in a chronological manner. This is shown in the below figure.
How to Build A Practical Portfolio Roadmap
With this background and fundamentals, let’s learn how to build a practical portfolio roadmap in a step-by-step manner. I’ll be using the sample given in PMI’s Standard for Portfolio Management, third edition, and build on it with the MS Project software tool.
To build the portfolio roadmap, we will take the following steps.
Step 1: Add the Portfolio Components
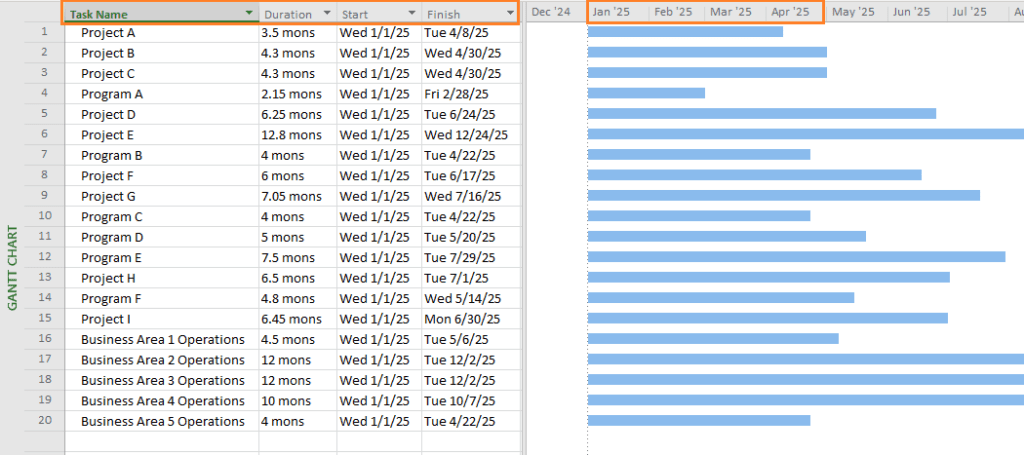
As noted earlier, a portfolio can have a number of components or initiatives. For our case, we have the following components:
- Projects: Project A, B, C, D, E, F, and G
- Programs: Program A, B, C, D, E, and F
- Operations: Business Area 1, 2 and 3 Operations
Each of these components should be added as tasks into the MS Project plan (.mpp) file. As you add, you should also provide the high-level timeline for each component as shown below.
As shown above:
- We have multiple projects, programs, and operations added into the initial portfolio roadmap.
- For each portfolio component, we have duration, start, and finish dates. These are high-level details. The portfolio roadmap is prepared iteratively and repeatedly adapted.
- On the right side of the Gantt Chart, we have portfolio components represented as horizontal bars.
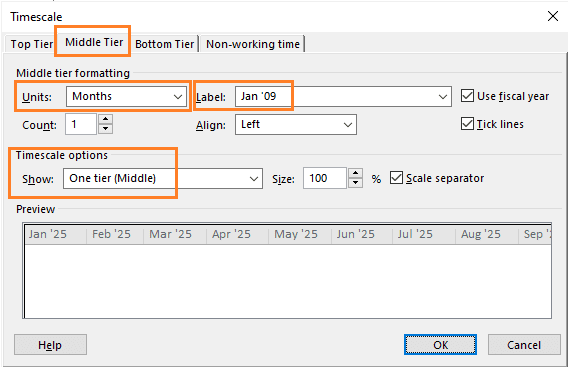
Also, ensure that the timescale is properly customized. To do so, go to the timescale part of the Gantt Chart’s graphical side (on top), right click and choose “Timescale…”.
As shown above:
- We have just one tier (middle).
- Units are “Months”.
- Label is “Jan ‘09”.
Adjusting the timescale will result in a better visualization for your roadmap.
Step 2: Differentiate the Components
In this step, we will differentiate the components to have more clarity in our graphical representation. For this purpose, I’ll add two custom fields by going to the Format tab > Columns group > Custom Fields command. Both the custom fields are of Boolean type.
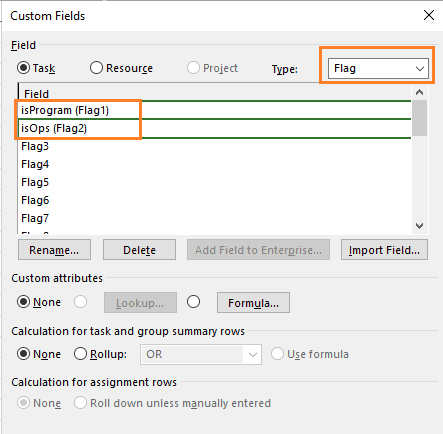
As shown above, we now have two Boolean custom fields: isProgram and isOps. These will be used in the next step.
Step 3: Format the Bar Styles for Components
In this step, we will add two more bar styles by going to Format tab > Bar Styles group > Format drop-down menu > Bar Styles command.
For our program components, we will have green color-coded bars with the isProgram flag applied, whereas for the operation components, we will have orange color-coded bars with the isOps flag applied. In addition, for all the portfolio component bars, we will have the end shape changed to inverted triangles, along with the type and color. This is shown and highlighted below.
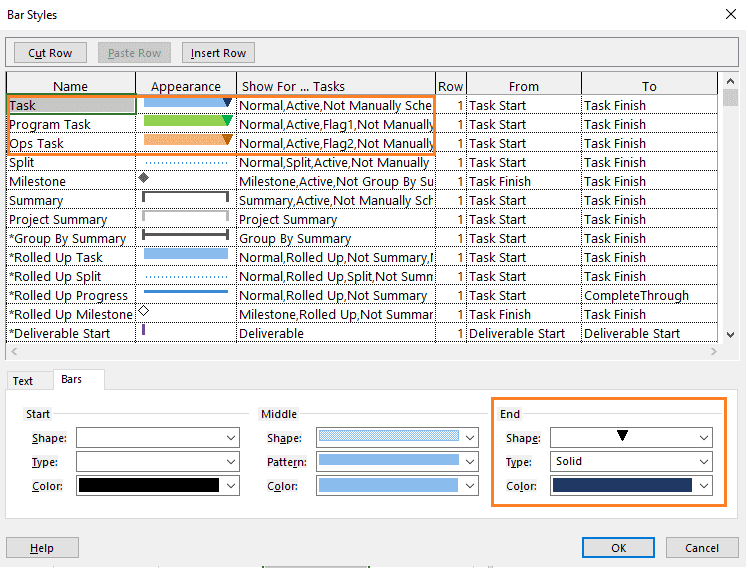
As shown above:
- For the project components, we have the default blue colored bars. The end shape has been changed. For the program components, we have the green colored bars. And for the operation, we have orange colored bars.
- The respective conditions applied for the components are:
- Normal, Active, Not Manually Scheduled (project components)
- Normal, Active, Flag1, Not Manually Scheduled (program components)
- Normal, Active, Flag2, Not Manually Scheduled (operation components)
- For all bar styles, the end shapes have been changed. This clearly shows the finish time of the respective components.
Step 4: Apply the Bar Styles for Components
Now that we have customized the bar styles, we have to apply them to our Gantt Chart view to have the visualization. To do so, I’ll remove the earlier columns of Duration, Start, and Finish, but add two new columns of isProgram and isOps. Remember we just added these two custom fields (columns). Next, for each program component, the isProgram flag will be enabled and for each operation component, the isOps flag will be enabled. This will result in the following figure.
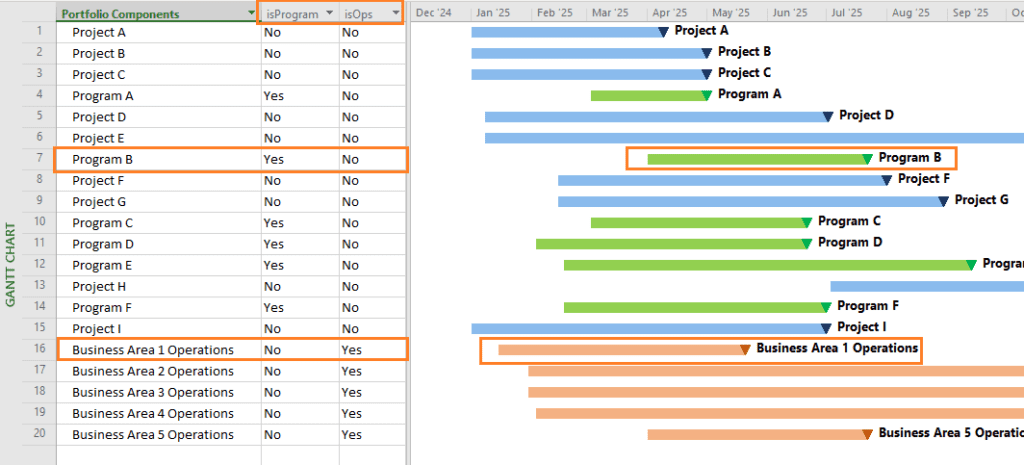
As shown:
- For Program B, the isProgram flag is enabled, but isOps flag is disabled. It’s shown in green colored bars.
- For Business Area 1 Operations, the isOps flag is enabled, but isProgram flag is disabled. It’s shown in orange colored bars.
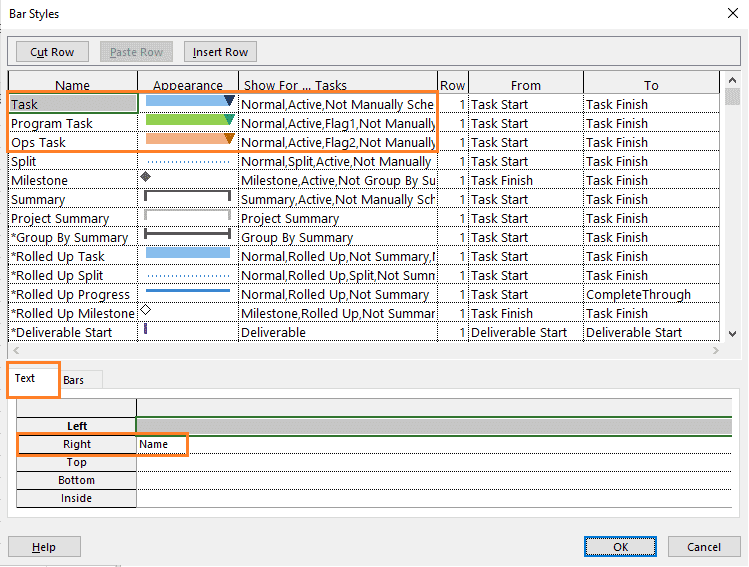
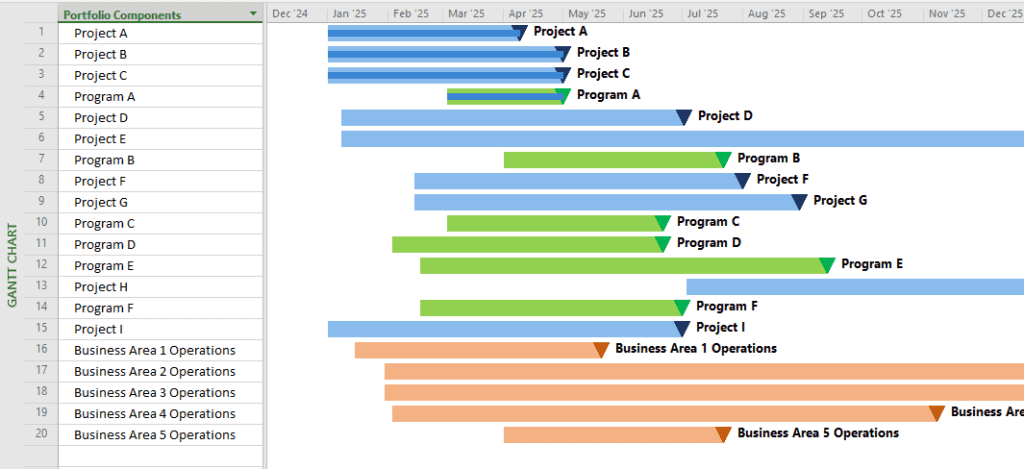
To have the name of the portfolio components on the right side of the bar, ensure that the “Name” field is populated in the bar styles as shown below.
Isn’t it a much better representation than the earlier one?
The flag setting with bar style formatting is also very useful when new portfolio components are added. You only need to enable or disable the flags and the color will automatically change.
Step 5: Track Progress with Portfolio Roadmap
A portfolio, if completely new, can be authorized, or some of its components can be authorized, by the portfolio governing body. Post authorization, the portfolio components will be in progress or under execution.
As the portfolio components are executed by the resources (financial, assets, and human), we will have progress reported on the components. Let’s say a few of the components are complete and we have to display the progress. For this purpose, we simply have to use the ‘% Complete’ column and show 100% completion.
When visualized with completed portfolio components, we will have the following view.
As shown:
- We have three projects, Project A, Project B, and Project C, which are complete.
- We have one program, Program A, which is complete.
- The completion is shown with a small horizontal line going inside the bar.
For a clear visualization of completion (a line going inside), I’ve increased the size of the bar by going to Format tab > Format group > Layout command and then changing the bar height to 18, instead of the default 12.
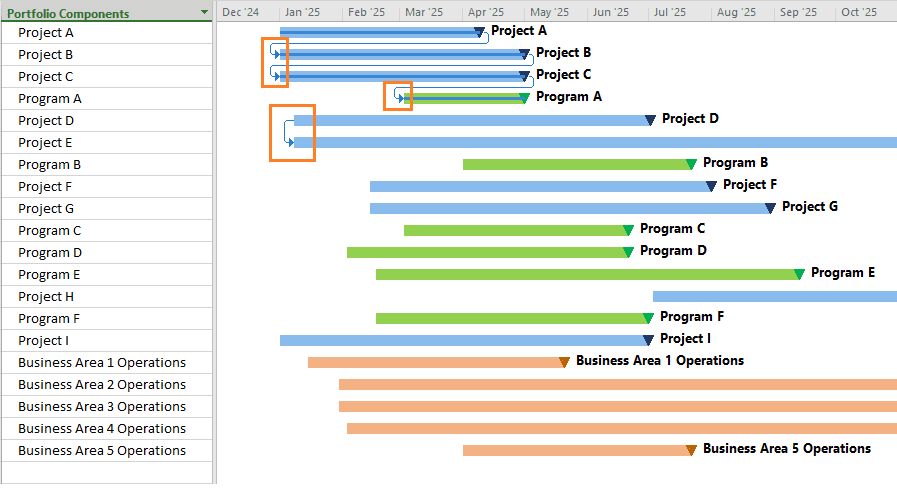
Dependencies in the Portfolio Roadmap
As we learned in the beginning, the portfolio roadmap also shows the dependencies among the components and/or across business areas. Dependencies can be easily shown by using the predecessor field of MS Project software. For example, in the below figure, we have dependencies shown among multiple component projects and programs of the portfolio.
Portfolio Component Grouping
The Standard for Portfolio Management, also informs that the completed portfolio components can be grouped and displayed on top of the roadmap. This also can be done with MS Project software.
For this purpose, I’ll use the built-in Complete and Incomplete Tasks group, which can be seen by going to View tab > Data group and selecting this group from the Group drop-down menu. In this grouping, we will change the order to descending.
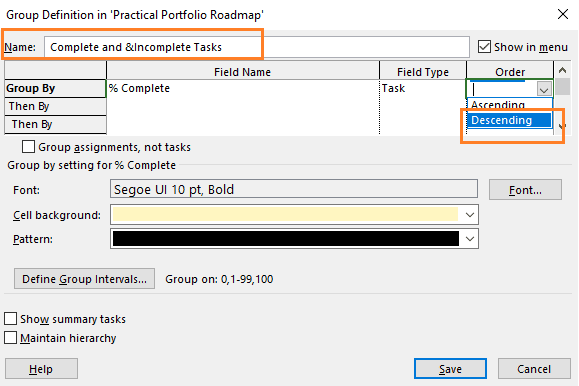
As shown above, only change the order to ‘descending’ and keep the rest of the formatting as it is. Now, when you apply the grouping, we will have the following view.
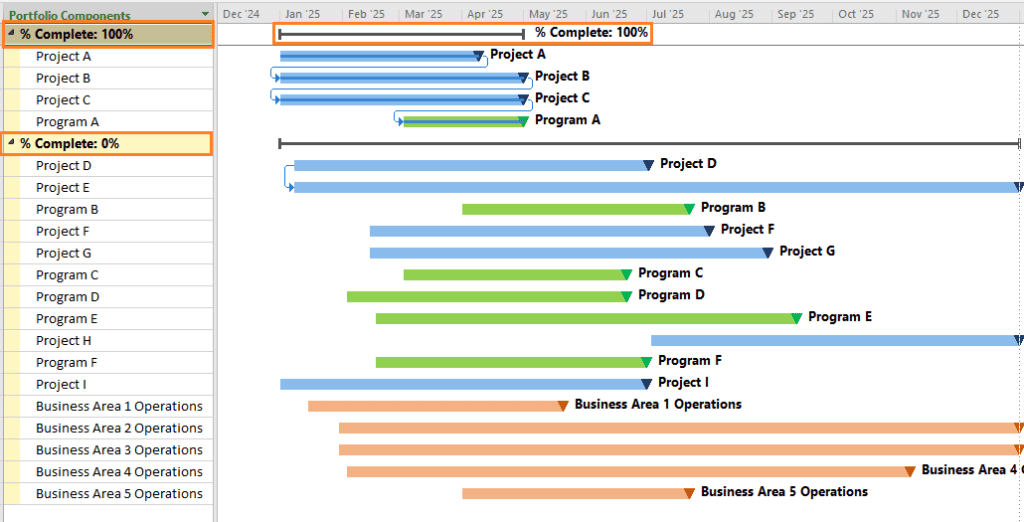
Clearly, the components which are 100% complete are shown on top, whereas the ones not complete, or yet to be started, are shown towards the bottom of the above view.
Conclusion
Now that we have clearly understood the portfolio and portfolio roadmap, along with their components and elements, I’ll come back to our opening quote. But I’d slightly rephrase it and say:
Project creates and delivers. Program coordinates and guides. Portfolio decides and drives.
A portfolio not only decides the components to be taken but also drives them in order to achieve the organizational strategies and objectives. The portfolio roadmap, on the other hand, is a key deliverable and indispensable tool used in portfolio management. The roadmap shows the strategic mapping, “to-be” vision of the portfolio, priorities, and dependencies, as well as the high-level plan.
The portfolio roadmap, along with the portfolio strategic plan and portfolio charter, drive the development of the portfolio management plan – the consolidated plan that drives the execution of the portfolio and its components.
I hope this article helps you in preparing for the Portfolio Management Professional (PfMP®) certification exam and also enables you to apply your learning on portfolio roadmaps in real-world portfolio management.
References
[1] NEW Book – I Want To Be A PfMP, the plain and simple way, by Satya Narayan Dash
[2] Article – Understanding Portfolio Strategic Alignment, by Satya Narayan Dash
[3] The Standard for Portfolio Management, by Project Management Institute (PMI)
Related Content
- Creating a Program Roadmap Using the Roadmap Application
- Portfolio Management with Project for the web
- Project Portfolio Management – Certificate Series Directory

Elevate your project management skills and propel your career forward with an MPUG Membership. Gain access to 500+ hours of PMI-accredited training, live events, and a vibrant online community. Watch a free lesson and see how MPUG can teach you to Master Projects for Unlimited Growth. JOIN NOW


Ronald B. Smith, PMP
Nice detailed topic/article!
Satya Narayan Dash
Thank you, Ron.