Customer Acquisition Cost - the one metric that can determine the fate of a business. We hear it being mentioned more and more in financial reports, and with the advent of internet-oriented businesses, we can now accurately calculate it.
This applies to precisely targeted marketing campaigns, where we follow the user’s behavior from the first interaction to the key moment when the conversion occurs. Then we have a complete picture of this success indicator.
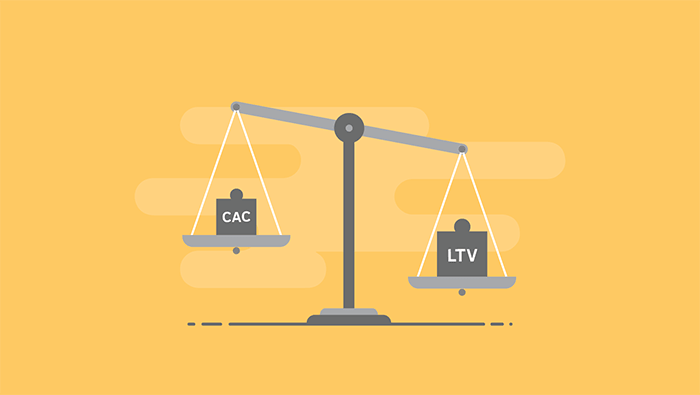
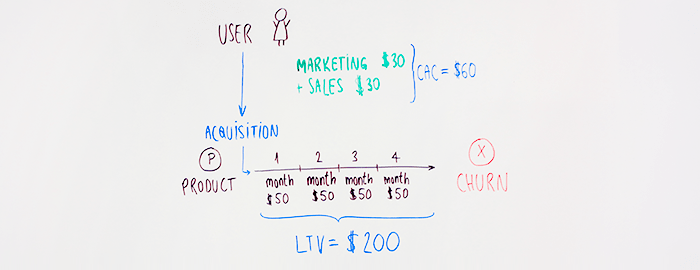
Which means that the CAC is the price we pay for someone buying our product.
On the other hand, the metric that complements the success of CAC is LTV - or Customer Lifetime Value. This represents the sum of all payments, all the income we received from a specific user.
Why is this important to us?
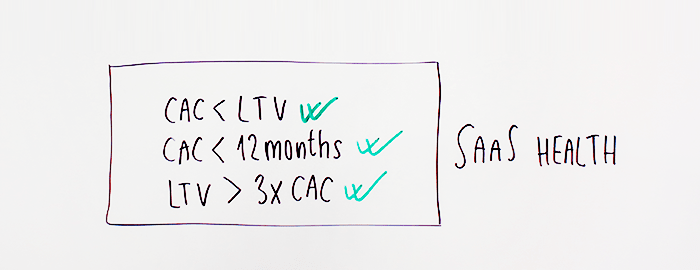
If the CAC is larger than the LTV, we have a problem - we are overpaying our users to buy our tool. Meaning - we are operating at a loss in the long run.
The most commonly accepted view is that the LTV should be 3x higher than the CAC, meaning LTV > 3x CAC.
The CAC should recoup its budget in less than a year because CAC < 1 year.
For SaaS companies, we can calculate the LTV in two ways:
- ($) Average monthly revenue per customer X (#) months of customer lifetime = ($) LTV
- ($) Average monthly revenue per customer / monthly churn = ($) LTV
In an LTV to CAC calculation, we are trying to achieve a 3:1 ratio. For example, if our customer lifetime value (LTV) is $15,000 and our expenses for acquiring a customer (CAC) are $5,000, then our LTV:CAC ratio would be 3:1.
Calculating the LTV:CAC ratio is an excellent way to see if our company is positioned for sustainable growth. This ratio functions as a key performance indicator (KPI) for determining how much (or how little) we are spending on marketing and sales - to maximize our growth and stay ahead of the competition.
However, the downside of monitoring only this KPI is that this forecast can quickly change. For example, the LTV could drop if a new competitor enters the market, or rise if we make a genuinely positive and groundbreaking change to the product. This is completely normal and to be expected - tuning this formula is an ongoing process, one which we are constantly perfecting.
When you have these metrics clearly defined and measurable, creating a dashboard to visually represent your situation will be useful. After all, it’s much easier to gauge the real value of these measurements when you have them right in front of you. There are many free and easy to use applications for this, so I recommend downloading one and giving it a try.
I already wrote about the importance channels of acquisition play in ActiveCollab, so, naturally, we take the CAC into account in just about every channel we deal with. We know how big the CAC is with Adwords, Facebook, etc. From this we have also extrapolated the LTV from each channel and we have a live campaign reporting dashboard where we see the profitability of advertising at all times. Based on this, we are encouraged to redirect marketing budgets to channels where this ratio is healthy.
Today, there are a lot of different metrics that could be useful to you. Assess whether this calculation is relevant to your business. If the answer is “no” - discard it. Make your own calculation and maintain a positive profit rate.