


PERT Chart : What is a PERT Chart and How To Use It For Project Management?
Project management is often a demanding task. To make the job easier, there are certain methodologies and frameworks you can follow. One of them is the PERT chart. If you're new to project management or want to learn more about the PERT method, then this article is for you. We explain thoroughly what PERT is and how you can use it for your project.
What is PERT in Project Management?
There are different ways of looking at a project from inception to completion. PERT Chart is a tool for project management that offers a graphical view or representation of the project being managed. More precisely, it's concerned with the project timeline.
PERT Chart breaks down each task or component for further analysis. Based on this analysis, project managers can conclude important information that will determine project progress.
Before the charts were used in business, they were used at the US Navy's Special Project Office way back in 1957. The purpose was to guide the Polaris nuclear submarine project.
The charts have circles and rectangles, which are called nodes. And these represent the event and milestones for the project. Lines, also known as vectors, connect the nodes.
By looking at the PERT Chart, a manager would determine the time and resources required to complete the project.
What Are The Terminologies Involved In The PERT Chart?
PERT stands for Program Evaluation and Review Technique, but there are several terminologies that you must learn before correctly interpreting a PERT chart.
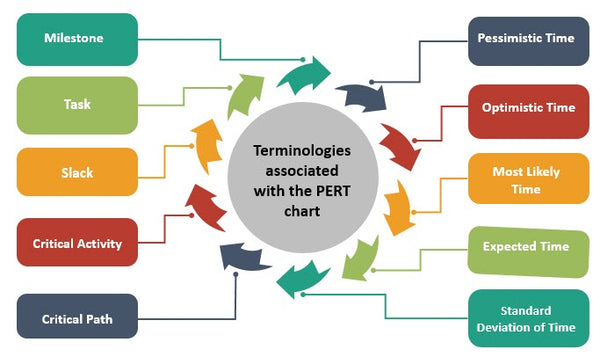
Some of the most common terminologies associated with the PERT chart are the following:
1.Milestone :
Also known as a PERT Event, a Milestone is a PERT chart element that marks the start and end of a task or a collection of tasks. It does not consume any time or resources. There are two types of milestones: Start milestone and Finish milestone.
2.Task:
In a PERT chart, Task is the arrow-shaped element representing the activities performed for progress. There are two tasks: predecessors (tasks preceding a milestone) and successors (tasks following a milestone).
3.Slack:
Slack or Float is the quantification of the excess resources or time required for task completion. In other words, it's the amount of time that you can afford to delay without disrupting subsequent tasks.
4.Critical Activity:
Critical activity is those activities that have zero slack. However, it's not required that activity with zero slack be on the critical path as it may not be the longest path.
5.Critical Path:
The critical path is the longest continuous path possible on the PERT Chart, leading to a terminal event from an initial event. It also helps to determine the total duration of a project.
6.Pessimistic Time :
It's the maximum amount of estimated time required to accomplish an activity, given that nothing will go as planned. But you'd have to exclude major catastrophes.
7.Optimistic Time :
Opposite to the previous terminology, Optimistic time is the minimum possible time required to complete an activity. You'd have to assume that everything will go as planned.
8.Most Likely Time :
It's the most accurate estimation of the time required to complete an activity, given everything proceeds as normal.
9.Expected Time:
It's the most accurate estimation of the time required to complete an activity or path, considering that not everything works as planned. So you have to calculate the most probable catastrophes.
10.Standard Deviation of Time:
The standard deviation of time is the variability of time that's calculated for completing an activity. You'd have to use some statistics for this calculation.
What is PERT in Project Management?
You know what the PERT chart is and the associated terminologies. Now let's understand how it works in project management.
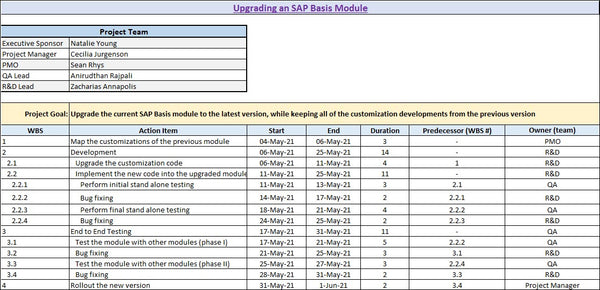
PERT chart works by identifying tasks and milestones, mapping the critical path, and estimating the time required to complete the project.
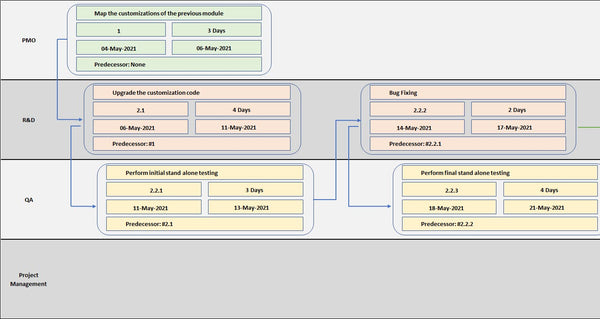
Project managers examine each activity of the project and estimate the duration for each activity.
To interpret a chart, here's how to read it:
- The tasks are contained within rectangular or square nodes and numbered.
- The direction of arrows notifies about the flow and sequence of events.
- Diverging arrows represent concurrent tasks that are quite possible.
- Dotted lines represent dependent tasks or dummy activities that do not call for any resources. These are located on another PERT path.
- Each vector has numbers and time allotments written on top of it.
The advantage of this representation is that it simplifies complex projects. In addition, since they provide estimation for each activity, the managers can accurately and confidently determine the time, cost, and resources estimate.
Along with that, it's cross-functional. You can involve multiple departments and subject matter experts. Project managers will get an overview of which department is working on which activities. Thus, they can map responsibility and keep everyone accountable.
Difference Between PERT and CPM
PERT and CPM are two common project management techniques. But their approach to project management is different. And thus, you may get different results. So it's wise to learn about the inherent differences between the two techniques.
- PERT stands for Project Evaluation Review Technique, while CPM is abbreviated for Critical Path Method.
- PERT is used for managing projects with uncertain activities. CPM is used for managing projects with mostly known and certain activities.
- PERT is event-oriented, which means you draw the network from event to event. While CPM is activity-oriented, and the network is constructed from activity to activity.
- PERT is a probability model, CPM is a deterministic model.
- Mainly PERT focuses on time and completion of the project. On the other hand, CPM focuses on the time-cost tradeoff, and the cost is more important here.
- PERT has non-repetitive jobs, CPM has repetitive jobs.
- In PERT, there is no likelihood of crashing since time is uncertain. However, with CPM, the project can crash if not completed within a certain time.
- PERT is useful for research and development projects. On the other hand, CPM is more geared towards manufacturing and construction projects.
You'd have to choose from either PERT or CPM after careful analysis. However, many organizations are seeing success with the graphical representation that PERT has on offer. So get started with PERT today and start exploring the hypothetical.
