


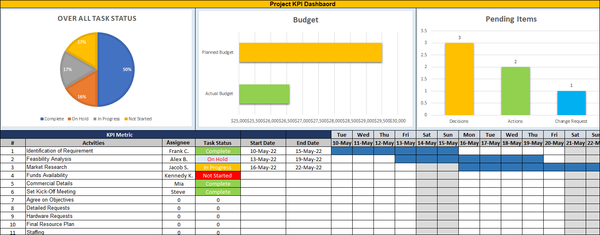
KPI Dashboard Template
What is a KPI Dashboard?
A KPI dashboard is a type of performance dashboard that is used to track and monitor the key performance indicators (KPIs) of an organization or business.
A key performance indicator (KPI) dashboard is a visual display of the most important metrics and KPIs in an organization. A KPI dashboard can be used to track progress against specific goals, to identify trends and outliers, and to compare performance across departments or divisions.
The KPIs that are tracked on a KPI dashboard can vary depending on the specific industry or business, but some common examples include measures of sales, website traffic, conversion rates, customer satisfaction, and employee productivity.
Dashboards can be customized to display the information that is most relevant to the user, and they can be updated in real-time to reflect changes in data. KPIs can be displayed in a variety of ways, including charts, tables, and gauges.
There are many software applications that allow users to create and share KPIs, and these can be used to create dashboards that can be accessed from anywhere in the world.
A KPI dashboard can be a powerful for business leaders, as it provides a clear overview of how the organization is performing against its key objectives. Furthermore, a KPI dashboard can help identify areas of improvement or potential areas of concern.
Why Are KPI Dashboards So Important?
A key performance indicator (KPI) is a measurable value that demonstrates how effectively a company is achieving key business objectives.
organizations use KPIs at multiple levels to evaluate their success at reaching targets. For example, a companywide KPI might track overall revenue, while a departmental KPI might track customer satisfaction levels. In either case, KPIs provide valuable insights that can be used to make business decisions.
One of the best ways to track KPIs is through the use of dashboards. A KPI dashboard is a visual display of KPIs that provides up-to-date information on progress towards goals. Dashboards are an essential tool for tracking KPIs because they make it easy to see how well a company is performing briefly.
There Are Many Ways to Create a KPI Dashboard, but All Dashboards Should Include the Following Elements:
- A clear and concise visual layout
- The ability to track multiple KPIs
- The ability to drill down into data for further analysis
- The ability to share data with others
The best dashboards are those that are custom-built to meet the specific needs of an organization. Dashboards should be designed in a way that makes it easy for users to find the information they need and to understand what the data means.
What Should a KPI Dashboard Include?
Dashboards are a valuable tool for organizations because they provide a clear and concise way to track progress Towards goals. By including all the information listed above, a KPI dashboard can help organizations make better decisions and achieve their goals.
A KPI or Key Performance Indicator is a metric used to measure and track progress towards a specific goal. There are many different types of KPIs, and the key is to choose the right ones for your business.
A KPI Dashboard allows you to easily track, monitor, and visualize your KPIs in one place. The best dashboards are those that are simple, visually appealing, and easy to use.
When choosing KPIs for your dashboard, there are a few things you should keep in mind. First, you want to choose KPIs that are relevant to your business and that will give you the insights you need to make informed decisions. Second, you want to choose KPIs that are actionable, meaning that you can take steps to improve them.
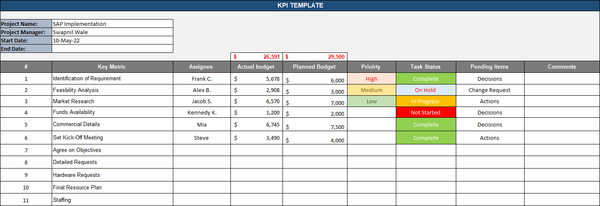
With That Said, Let’s Look at Some of the Things You Should Include in Your KPI Dashboard:
- A clear and concise title that accurately reflects the contents of the dashboard.
- An overview of the KPIs included in the dashboard.
- A visualization of each KPI, such as a graph or chart.
- The current value of each KPI, as well as the target value.
- The period for which the data is relevant (e.g., month-to-date, year-to-date, etc.).
- An indication of whether each KPI is on track, above target, or below target.
- A space for comments or notes about each KPI.
- A way to export or share the dashboard with others
5 Great Reasons Why You Need a KPI Dashboard
A KPI or key performance indicator is a type of performance measurement. It is a helps organizations track and monitor progress towards their goals. There are many different types of KPIs, but they all share one common goal: to provide insights that can help improve decision-making.
Dashboards are to help organizations visualize data. They can be used to track KPIs in real-time and identify trends. Dashboards can be customized to display only the data that is relevant to the user.
There Are Many Reasons Why You Need a KPI Dashboard. Here Are 5 of the Most Important Ones:
- A KPI dashboard gives you a quick overview of how your business is performing against key metrics.
- It allows you to drill down into the data to find out what is driving your results.
- You can use a KPI dashboard to track progress over time and spot trends.
- It can help you identify areas of your business that need improvement.
- A KPI dashboard can help you communicate your results to stakeholders.
List Out the Benefits of KPI Dashboard
A KPI or Key Performance Indicator is a metric used to measure progress and success. There are many different types of KPIs, but they all have one common goal: to help organizations track and improve performance.
A KPI Dashboard is a tool that allows businesses to track, visualize, and analyze KPIs in real time. It provides a clear overview of progress and helps identify areas of improvement.
There are Many Benefits of Using a KPI Dashboard, Including:
- Increased Visibility: A KPI Dashboard provides a clear and concise overview of progress, making it easy to identify areas of improvement.
- Improved Decision-Making: By visualizing data in a KPI Dashboard, businesses can identify trends and make informed decisions about where to allocate resources.
- Increased Efficiency: A KPI Dashboard enables businesses to track KPIs in real-time, allowing for quicker identification and corrective action of problems.
- Improved Communication: A KPI Dashboard provides a central location for all stakeholders to view progress and track goals, improving communication and collaboration.
- Enhanced Omni-Channel Support: A KPI Dashboard provides businesses with the ability to monitor KPIs across multiple channels, providing a complete picture of performance.