Remove pert-chart
article thumbnail

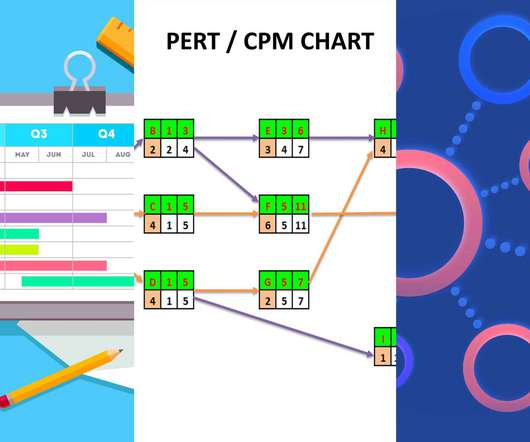
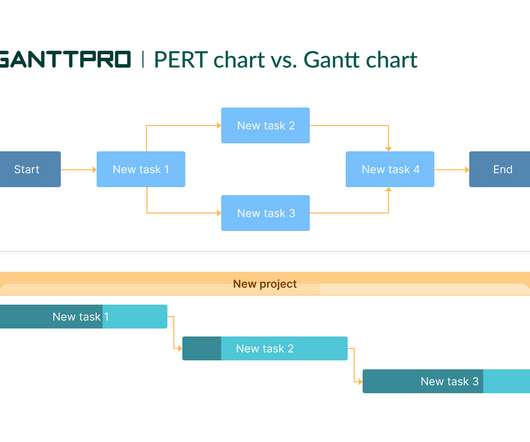
Gantt Chart vs. PERT Chart vs. Network Diagram: What Are the Differences?

ProjectManager.com

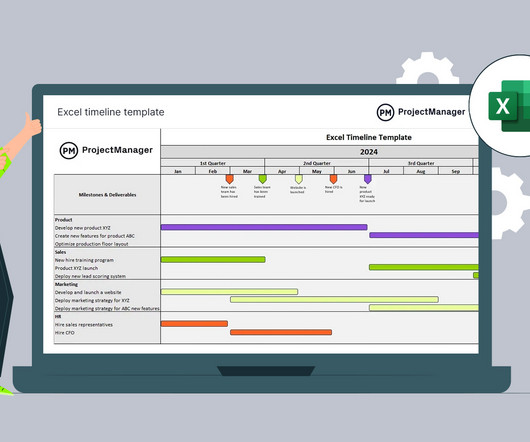
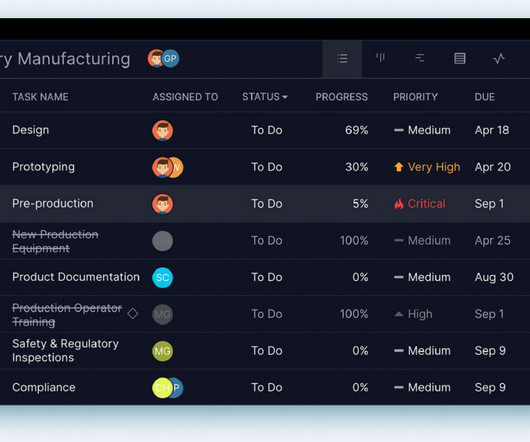
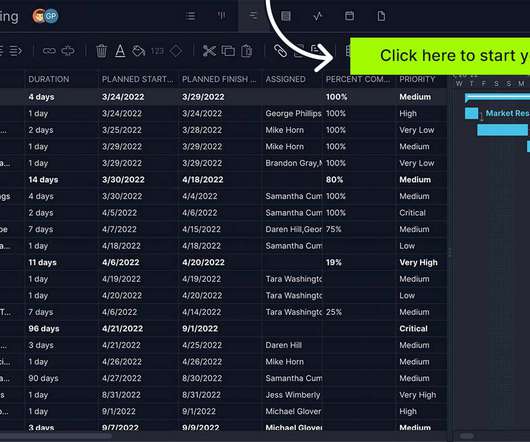
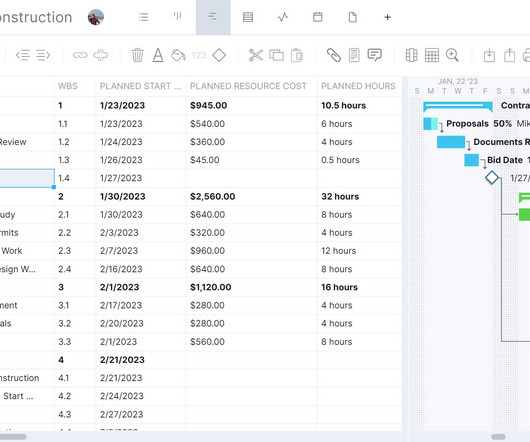
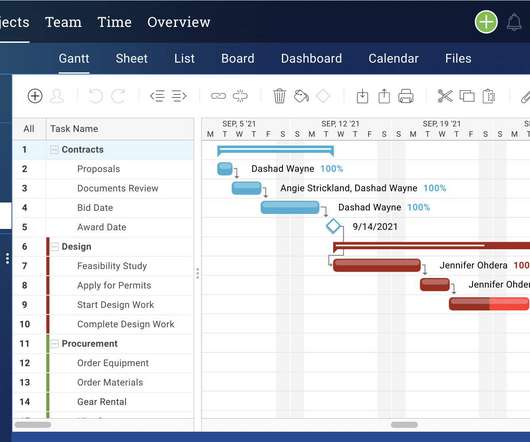
Let’s compare three of the more popular examples of project management diagrams: Gantt charts vs. PERT charts vs. network diagrams. What’s a Gantt Chart? A Gantt chart is used to visually represent project schedules on a timeline. A Gantt chart is used to visually represent project schedules on a timeline.

article thumbnail

PERT Chart vs. Gantt Chart: What’s the Difference?

GanttPRO Project Management

One such tool is a PERT chart. What is a PERT chart? […]. The post PERT Chart vs. Gantt Chart: What’s the Difference? There are a bunch of tools and techniques for planning and coordinating tasks and resources in project management. first appeared on GanttPRO.

Planning 117
Insiders

Sign Up for our Newsletter

This site is protected by reCAPTCHA and the Google Privacy Policy and Terms of Service apply.

article thumbnail

How to Create a Timeline in Excel (Free Templates Included)

ProjectManager.com

Excel is a versatile spreadsheet tool that can create a variety of graphs, charts and forms, including timelines for projects. In this blog, we’ll go through each step needed to create a timeline in Excel and explain the advantages and disadvantages of doing so. Why Should You Create a Project Timeline in Excel?

article thumbnail

PERT and CPM: Their Differences and How to Use Them Together

ProjectManager.com

Project Evaluation and Review Technique (PERT) and Critical Path Method (CPM) are both useful tools when planning and controlling a project. PERT and CPM are complementary and both are important analytical techniques in project management when managing tasks. What Is PERT? PERT vs. CPM: Key Differences. What Is CPM?

Estimate 296
article thumbnail

Free Google Sheets Timeline Template: Create Plans Online

ProjectManager.com

ProjectManager is award-winning project and portfolio management software with Gantt charts that have timelines that do much more than static templates. The robust Gantt chart links dependencies, filters for the critical path and can set a baseline to track variance in real time. Google Sheets can’t do that.

article thumbnail

Leveraging PERT Charts for Effective Project Management

Wrike

One valuable tool that can help achieve these goals is a Program Evaluation and Review Technique (PERT) chart. PERT charts provide a visual representation of a project’s tasks, their dependencies, and the estimated time needed to complete each task. It represents the flexibility within the project schedule.

article thumbnail

5 Best Tools for Creating a Simple Gantt Chart

ProjectManager.com

Gantt charts are powerful planning tools in project management, but they’re also notoriously difficult to make. There is, however, a simple Gantt chart that can be made in a variety of ways that can be essential when scheduling a project. What Is a Simple Gantt Chart? Get started with ProjectManager today for free.