Remove precedence-diagramming-method
article thumbnail

An Intro to Precedence Diagrams & the Precedence Diagramming Method

ProjectManager.com

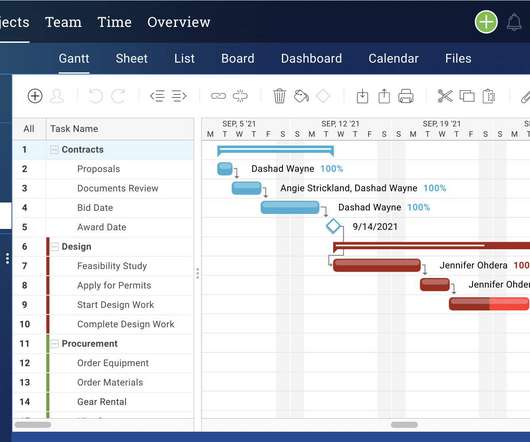
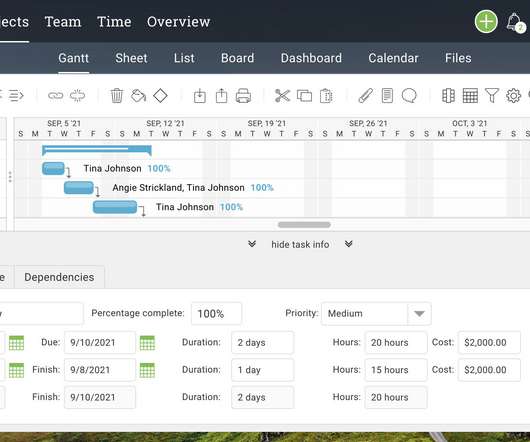
For example, there is the precedence diagram, which is used to visualize the tasks in a project from start to finish. If you’re not familiar with the precedence diagramming method, you’ve come to the right place. What Is a Precedence Diagram? Partial Precedence Diagrams. Learn more.

article thumbnail

Precedence Diagramming Method (PDM) Explained

Wrike

The precedence diagramming method (PDM) is one such assistive tool. The precedence diagramming method (PDM) is a graphical tool used for scheduling activities in a project plan. The primary output of PDM is a project schedule network diagram. Precedence Diagramming Method (PDM) advantages.

Insiders

Sign Up for our Newsletter

This site is protected by reCAPTCHA and the Google Privacy Policy and Terms of Service apply.

article thumbnail

How to Sequence Activities in a Project

ProjectManager.com

There are many different ways to do this, but today we’ll cover the Precedence Diagramming Method: The Precedence Diagramming Method uses a type of network diagram in order to show the activities which must be completed, how they’re connected and what the sequence the work must follow.

Defining 312
article thumbnail

3 Free Tools for Making Network Diagrams

ProjectManager.com

A project network diagram is one such tool that helps simplify a complex project plan, enabling a project manager to see the big picture of the project. But some might avoid network diagrams, thinking of them as those dense schematics that depict the nodes and connections in a computer network. What Are Project Network Diagrams?

article thumbnail

What Is a PERT Chart in Project Management?

Wrike

Meanwhile, a PERT chart is the visual diagram that results from using PERT. What is the difference between a PERT chart and a critical path diagram? . PERT and critical path method are both scheduling techniques a project manager can use to view task dependencies and estimate project durations. Slack = LF – EF.

Estimate 172
article thumbnail

What Is Float And How To Calculate Total & Free Float?

iZenBridge

During my coaching sessions, I observe a lot of confusion about different types of floats which can exist in a schedule network diagram. In this blog, I am drilling this down so that all the confusions go off. Schedule Network Diagram – is a graphical representation of the logical relationships. Now let’s get back to float.

article thumbnail

Project Management Glossary: 200+ Terms PMs Frequently Use

Epicflow Blog

is a conflict resolution method focused on agreement issues rather than controversial ones. Bottom-Up EAC (estimate at completion) Method . is a diagram demonstrating achieved business success. is a method of managing projects where the emphasis is made on resources performing project tasks. Accountability . Activities