


Power BI Gantt Chart: A How-to Guide With Pros, Cons & Alternatives
ProjectManager.com
FEBRUARY 21, 2024
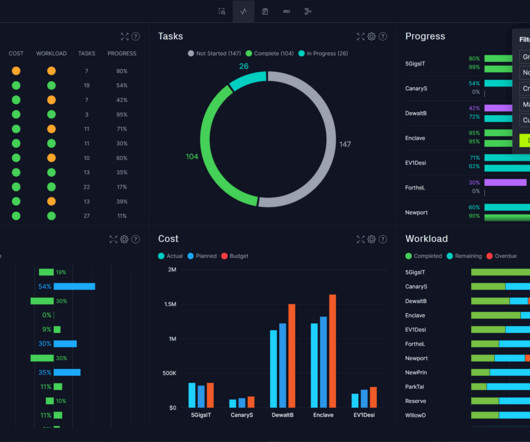
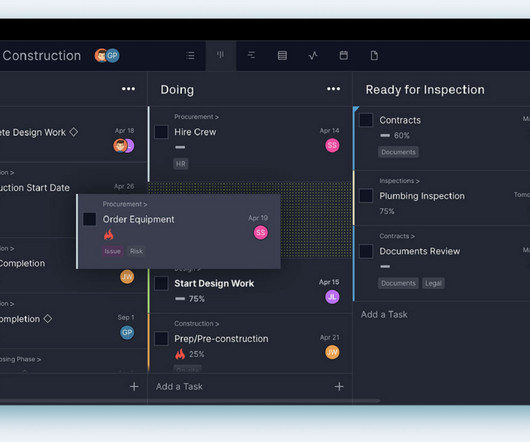
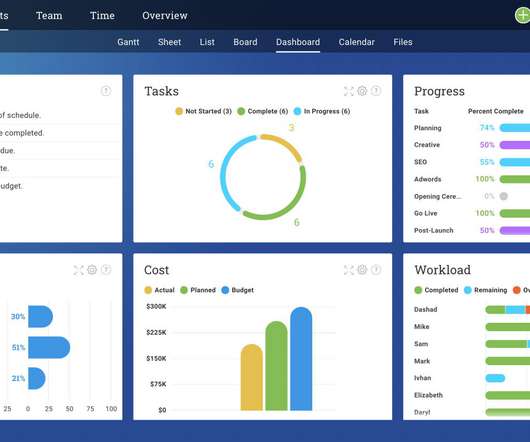
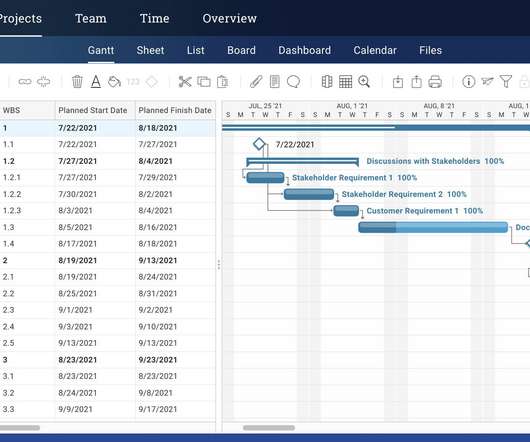
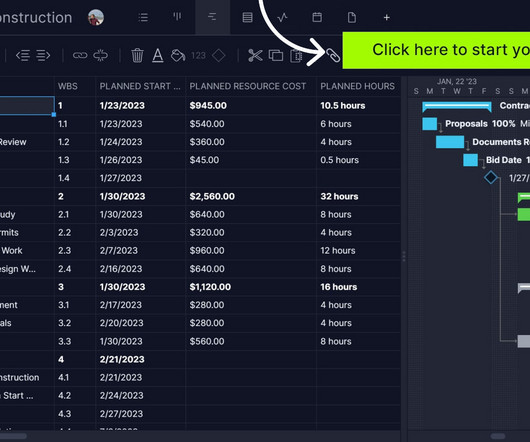
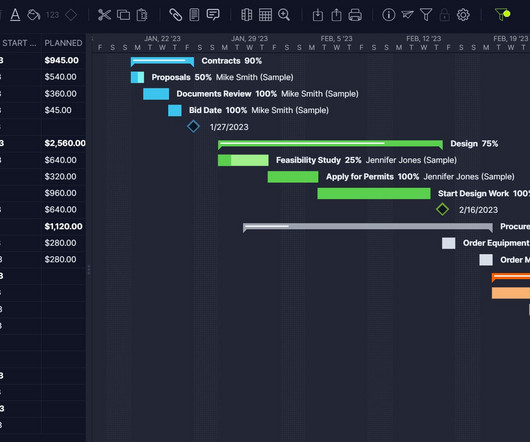
Microsoft Power BI is a data analysis software that allows you to use various tools such as spreadsheets, pie charts, stacked bars and other types of diagrams to visualize project or business data, including the Power BI Gantt chart. Learn more What Can You Use a Power BI Gantt Chart For? But is Power BI good for project management?


Let's personalize your content