Remove Budget Remove Critical Chain Remove Monitoring Remove Reference
article thumbnail

Bubble Graph: Critical Chain Fever Chart Re-Imagined

Epicflow Blog

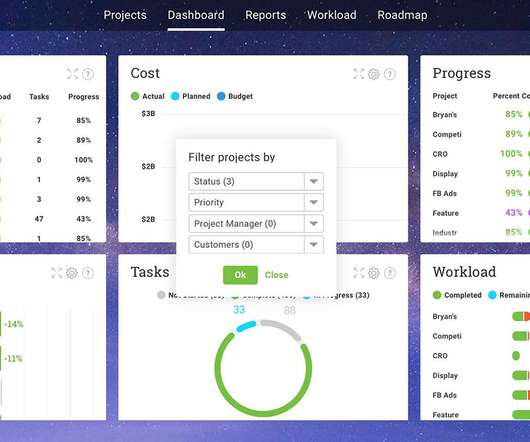
Let’s examine the way Epicflow’s team has made a classical critical chain (CC) tool called “Fever chart” more powerful with Bubble Graph. . A “fever chart” term is closely related to the Critical Chain Project Management (CCPM) from the Theory of Constraints (TOC). What’s Fever Chart? What’s Bubble Graph? Filtration.

article thumbnail

Project Management Framework Types, Key Elements & Best Practices

ProjectManager.com

There are many common types of frameworks that can be used for different projects, depending on how small or large your team is, the type of work they’re doing, the industry they’re in, how much time the project has and how much budget the project has. This is essentially the monitoring and management portion of your project.

Insiders

Sign Up for our Newsletter

This site is protected by reCAPTCHA and the Google Privacy Policy and Terms of Service apply.

article thumbnail

What Is Resource Leveling in Project Management?

Teamweek

Knowing how to monitor and manage project resources can make or break that project. Budget overruns: Projects that take longer than expected can lead to additional project costs and budget overruns. Free float refers to the amount of time you can delay a task without delaying the start of any immediately following tasks.

article thumbnail

Creating a Risk Register: All You Need to Know

Epicflow Blog

organizational risk (resources, budget, logistics, etc.); . red, yellow/orange, green) for visual reference. It’s usually a person responsible for monitoring the risk triggers and/or the one who is expected to deploy a risk response plan. [3]. Bubble Graph is another tool to monitor the state of projects. Risk response.

Risk 52
article thumbnail

Epicflow Glossary: Names of Features and Terms Used in the System

Epicflow Blog

A chart with project and budget views to show project workflow against the background of time and budget constraints, correspondingly. Read more: Bubble Graph: Critical Chain Fever Chart Re-Imagined. Budget View . It demonstrates the amount of work done and left in view of the approved budget. Bubble Graph.

article thumbnail

How to Choose the Right SaaS Product: Multi-Project Management Tool Selection Guide (Part 2)

Epicflow Blog

It refers to both macro and micro levels. Sometimes projects are interdependent, which is why considering all their details including task, resource, and budget levels are of crucial importance. . This is why the corresponding feature is significant and handy, so monitor its availability when considering the product.

Budget 98
article thumbnail

Fighting Uncertainty in Organizations, Including Matrix Ones

Epicflow Blog

When buffers are made visible, trust is crucial; without it, their presence can reinforce negative stereotypes, painting them as budget inflators rather than strategic tools. We’ll emphasize the limitations of relying solely on time buffers and advocate for a real-time dual-buffer approach that monitors both time and capacity.

2016 52