Remove charts-and-graphs
article thumbnail

3 Simple Charts and Graphs You Should Be Using to Make Your Next Project Presentation More Powerful

Project Bliss

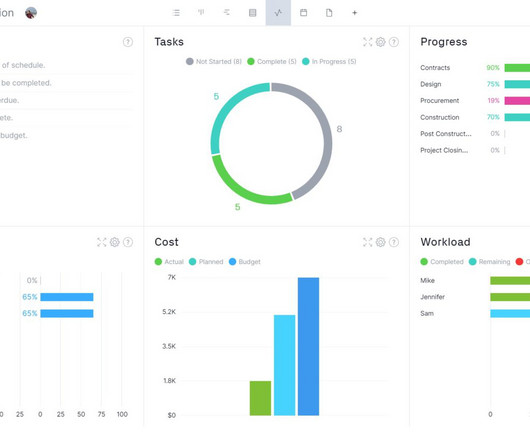
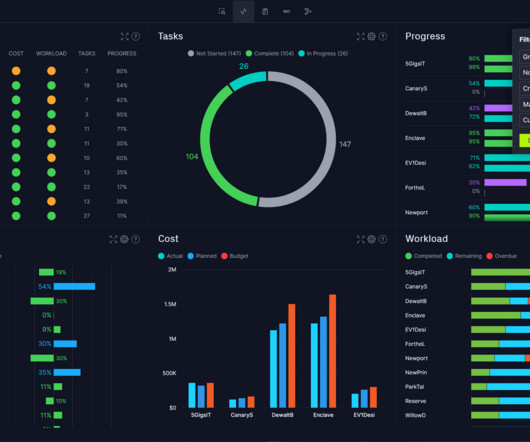
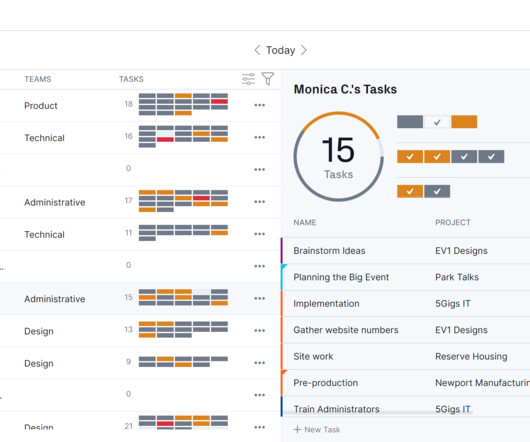
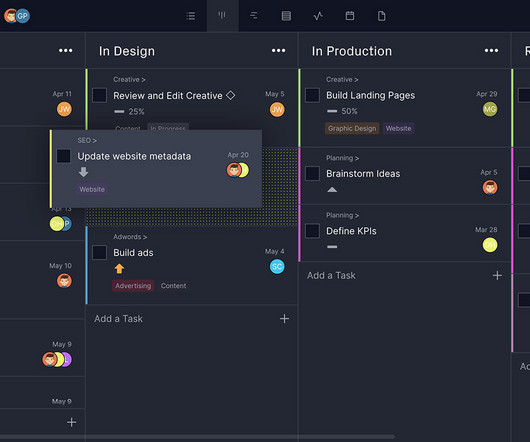
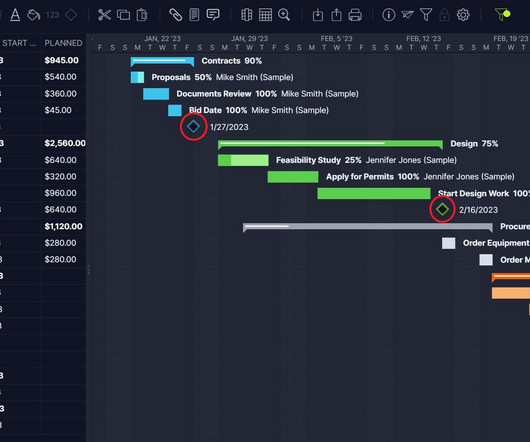
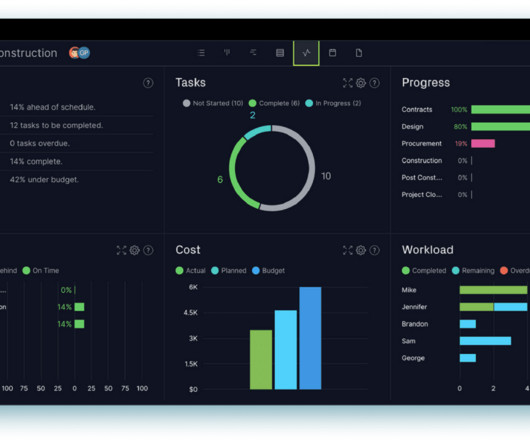
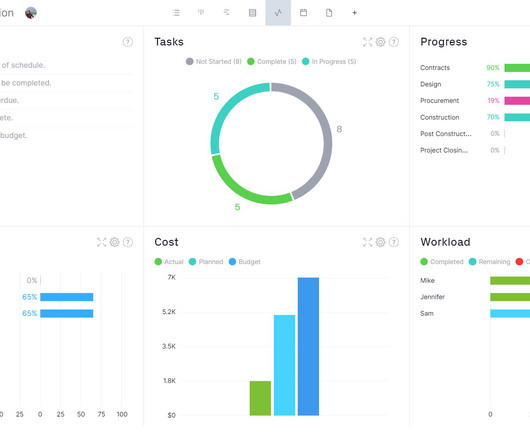
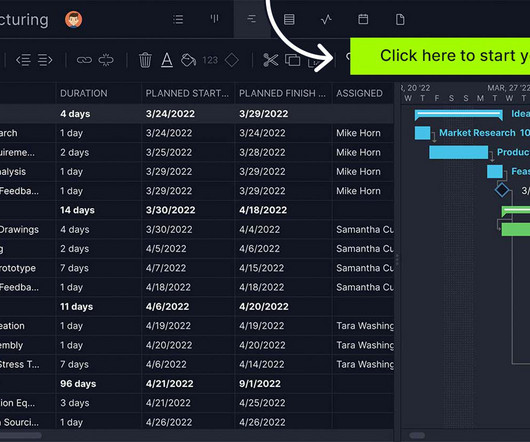
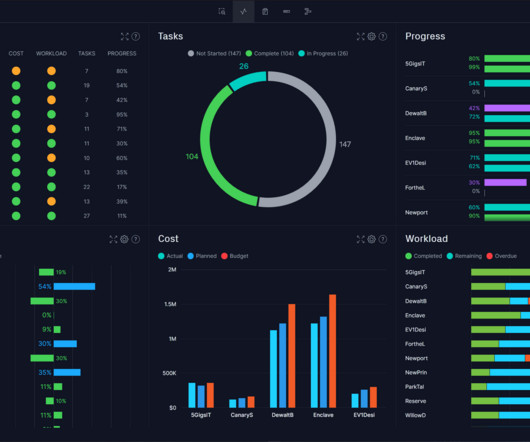
Charts and graphs are a great way to share important information about your project. These three simple charts and graphs will help you communicate project information in a way your audience can take in quickly. Charts and graphs are the perfect answer when you need to convey a lot of information clearly.

article thumbnail

How to Create a Timeline in Excel (Free Templates Included)

ProjectManager.com

Excel is a versatile spreadsheet tool that can create a variety of graphs, charts and forms, including timelines for projects. Static timelines are only a weaker version of a collaborative Gantt chart which is an integral project management tool. Why Should You Create a Project Timeline in Excel?

Insiders

Sign Up for our Newsletter

This site is protected by reCAPTCHA and the Google Privacy Policy and Terms of Service apply.

article thumbnail

Henry Gantt’s Biography & Role in Gantt Chart History

ProjectManager.com

The Gantt chart has become a staple of project management. Have you ever wondered why Gantt charts are capitalized or where the tool originated? Who was Henry Gantt and what was the history of the Gantt chart? We’ll provide a biography of the man and a short Gantt chart history. It’s the name of Henry Gantt (1861-1919).

article thumbnail

Free Google Sheets Timeline Template: Create Plans Online

ProjectManager.com

ProjectManager is award-winning project and portfolio management software with Gantt charts that have timelines that do much more than static templates. The robust Gantt chart links dependencies, filters for the critical path and can set a baseline to track variance in real time. They’re stored online.

article thumbnail

Monetizing Analytics Features: Why Data Visualizations Will Never Be Enough

Think your customers will pay more for data visualizations in your application? Five years ago they may have. But today, dashboards and visualizations have become table stakes. Discover which features will differentiate your application and maximize the ROI of your embedded analytics. Brought to you by Logi Analytics.

article thumbnail

How to Manage Your Project Pipeline With Software

ProjectManager.com

Our roadmaps show all your projects on a Gantt chart and visual timeline, which helps you prioritize tasks, allocate resources more effectively and meet your project deadlines. Projects have a beginning, middle and end. That’s called the project life cycle. What is a project pipeline? What Is a Project Pipeline?

article thumbnail

ProjectManager Now Integrates With Microsoft Power BI

ProjectManager.com

Power BI has a dashboard that reports on data in graphs, maps, charts, scatter plots and more. Power BI has a dashboard that reports on data in graphs, maps, charts, scatter plots and more. Users can now dig deeper into the data to find patterns that might have otherwise gone unnoticed. Why Integrate With Power BI?