Remove tags bar
article thumbnail

Gantt Chart vs. Kanban Board: Pros, Cons, Similarities & Differences

ProjectManager.com

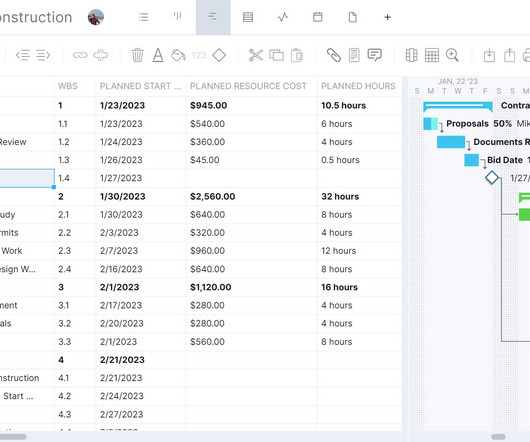
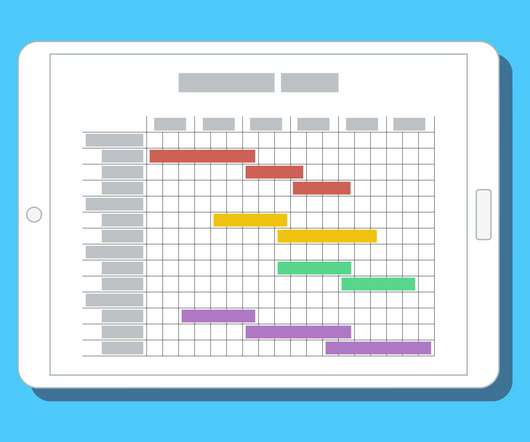
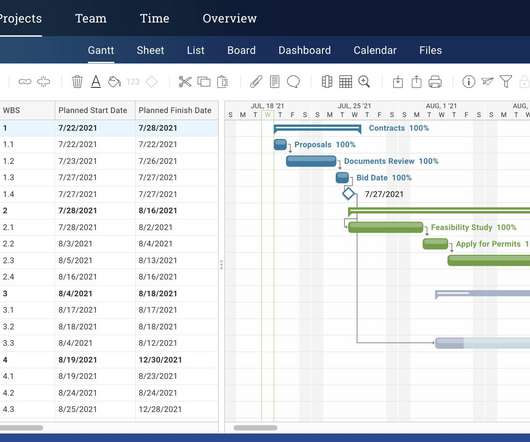
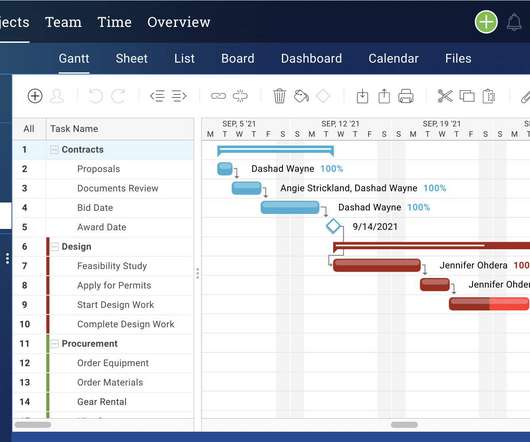
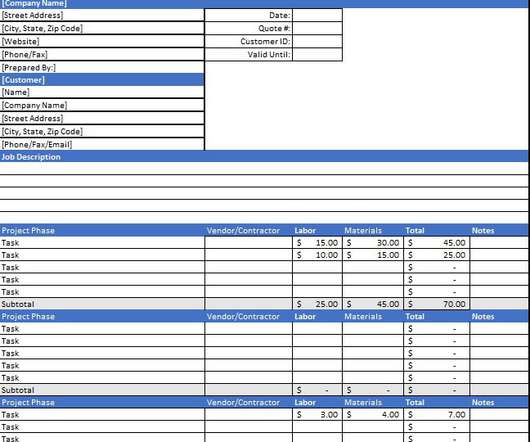
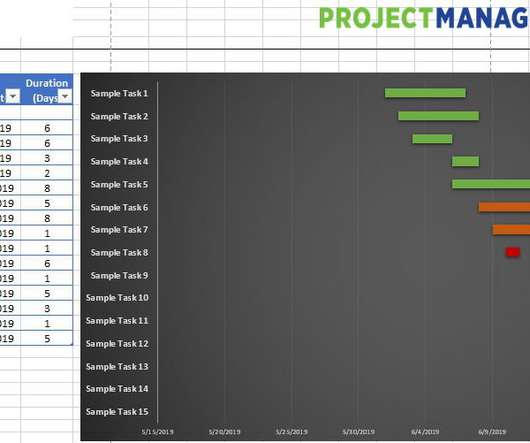
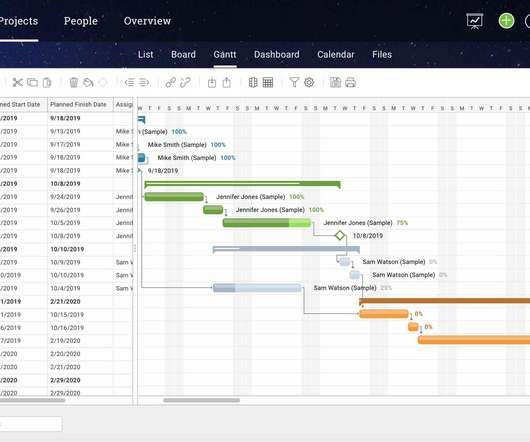
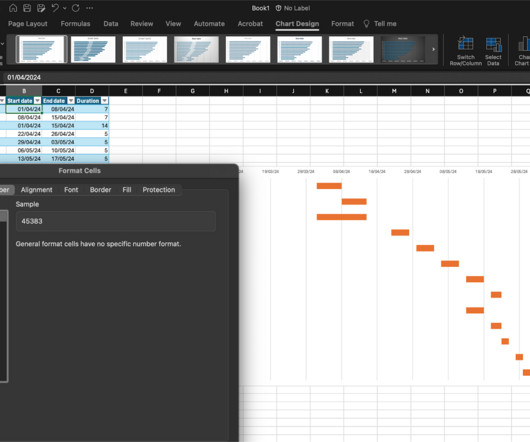
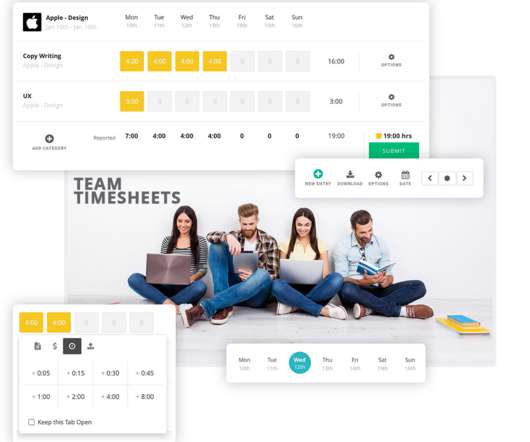
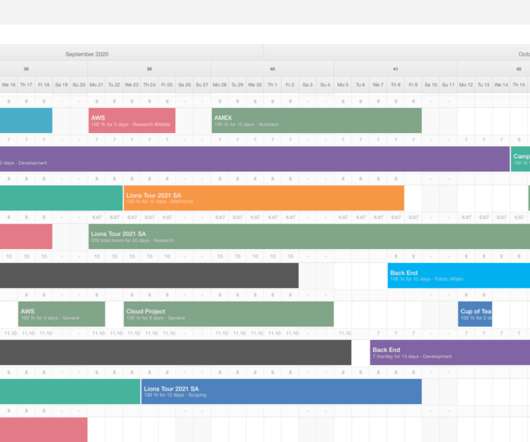
It’s a spreadsheet on the left side and a horizontal bar chart on the right. Here you can see the horizontal bar chart that makes up the right-hand side of the Gant chart. Each task is represented by a bar on the graph. The length of the bar is the planned duration of the task. What Is a Gantt Chart?

article thumbnail

Notion Kanban Board: Key Features, Pros, Cons & Alternatives

ProjectManager.com

For example, you can create a workflow automation rule that moves kanban cards to a certain column when a tag is added or assigns tasks to a team member when they have a particular priority level. ProjectManager’s kanban boards allow you to set up a variety of kanban workflow automation rules.

Insiders

Sign Up for our Newsletter

This site is protected by reCAPTCHA and the Google Privacy Policy and Terms of Service apply.

article thumbnail

Jira Kanban Board: Pros, Cons & Alternatives

ProjectManager.com

This timeline maker, however, can show your project timeline in a stacked bar chart like a Gantt chart, which allows software developers to make product roadmaps. Jira’s timeline tool is similar to a Gantt chart but lacks some Gantt chart software features, such as critical path management, resource scheduling or cost tracking.

article thumbnail

How to Make & Maintain a Project List

ProjectManager.com

Tag Priority. Tagging the priority of each item of your project list is another step in organizing your work. This is called the duration and will populate the timeline, with a duration bar connecting both dates. Set Priority & Tags. You can also add customizable tags, which make it easier to find specific tasks.

article thumbnail

Online Gantt Chart Maker: Free Trial & Walkthrough

ProjectManager.com

A Gantt chart, in essence, serves as both a spreadsheet and a bar chart for your project. Attach files and images to the task, set priority and tags to make it easier to find in a search. As your team updates their status, that information is instantly reflected by shading on the task duration bar. Assign & Collaborate.

article thumbnail

Displaying the Critical Path on a Gantt Chart (Example & Template Included)

ProjectManager.com

A Gantt chart is a bar chart that visualizes the project schedule from start to finish. On the right side is the bar chart that reflects the information collected on the left side. Even if someone on the project team isn’t assigned to the task, just tag them and they’re brought into the chat. Learn More! What Is a Gantt Chart?

article thumbnail

Notion Gantt Chart: Key Features, Pros and Cons

ProjectManager.com

By clicking these project timeline bars, you can see additional information for each task, such as their priority level, status, and subtasks. Use it to track all four types of dependencies, set priorities and tag team members to collaborate in real time. Now, let’s review the other half of a Notion Gantt chart.