


Burndown Chart: What Is It & How Do I Use It?
ProjectManager.com
FEBRUARY 13, 2019
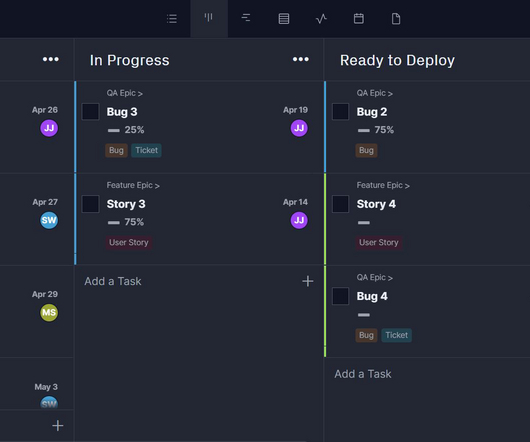
A burndown chart is one such tool for collecting that project data. Using a burndown chart is a means of seeing how much work is left and how much time there is to do it in. It’s a graphical representation, offering in a picture what a thousand words might not be able to communicate as clearly.


Let's personalize your content