Remove how-to-choose-the-right-project-management-tool-selection-guide
article thumbnail

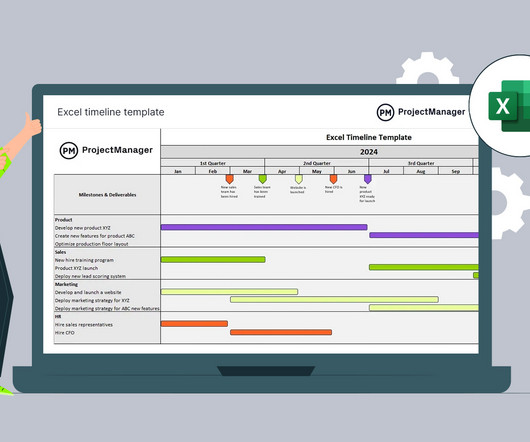
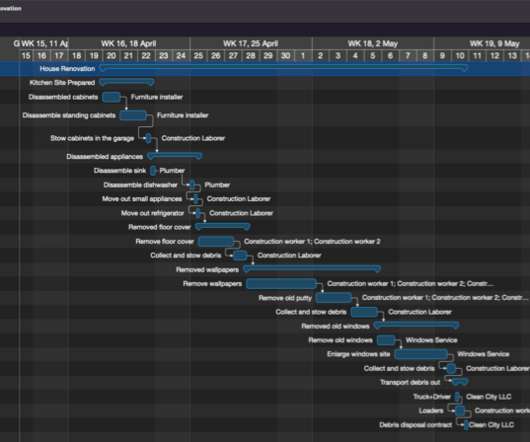
How to Create a Timeline in Excel (Free Templates Included)

ProjectManager.com

Excel is a versatile spreadsheet tool that can create a variety of graphs, charts and forms, including timelines for projects. In this blog, we’ll go through each step needed to create a timeline in Excel and explain the advantages and disadvantages of doing so. Why Should You Create a Project Timeline in Excel?

article thumbnail

Tableau Gantt Chart: A How-to Guide With Pros, Cons & Alternatives

ProjectManager.com

While Tableau doesn’t have project management features, you can still use it to make a Gantt chart. In this blog, we’ll learn how to make a Gantt chart in Tableau and explore its key features and limitations. ProjectManager’s Gantt chart is a robust project planning, scheduling and tracking tool.

Insiders

Sign Up for our Newsletter

This site is protected by reCAPTCHA and the Google Privacy Policy and Terms of Service apply.

article thumbnail

How to Create a Project Timeline In Excel (Free Template Included)

ProjectManager.com

A project timeline is a project scheduling tool that’s used to estimate the total duration of a project from start to end by mapping tasks, deliverables and milestones in chronological order. Why Should You Make a Project Timeline In Excel? We encourage you to download our free file below!

article thumbnail

Asana Gantt Chart: A How-to Guide With Pros, Cons & Alternatives

ProjectManager.com

Asana is project management software that offers a variety of easy-to-use tools like timelines, task lists and kanban boards which are mainly used for managing simple projects, everyday tasks and team workflows. It’s a good alternative for small teams that need to manage their workload and collaborate online.

article thumbnail

Power BI Gantt Chart: A How-to Guide With Pros, Cons & Alternatives

ProjectManager.com

Microsoft Power BI is a data analysis software that allows you to use various tools such as spreadsheets, pie charts, stacked bars and other types of diagrams to visualize project or business data, including the Power BI Gantt chart. But is Power BI good for project management? Does Power BI Have a Gantt Chart?

article thumbnail

How to Make a Gantt Chart in PowerPoint (Template Included)

ProjectManager.com

Gantt charts are one of the most important project management tools there are. That’s why project managers use them to manage projects of all sizes across industries such as construction, manufacturing, marketing and many more. In this guide, we explain how to make a Gantt chart in PowerPoint.

article thumbnail

Microsoft Project Gantt Chart: A How-to Guide With Pros, Cons & Alternatives

ProjectManager.com

The Gantt chart is one of the most important tools in a project manager’s toolbox. One side is a spreadsheet that collects important project data and the other is a visual timeline that shows the entire project from start to finish. What Can You Use a Microsoft Project Gantt Chart For?