Remove displaying-values-graphically
article thumbnail

Displaying Values Graphically

MPUG

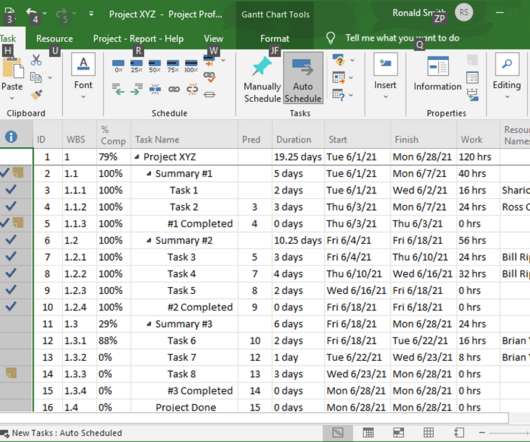
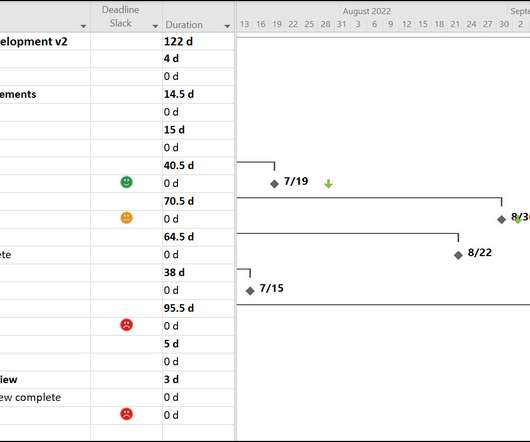
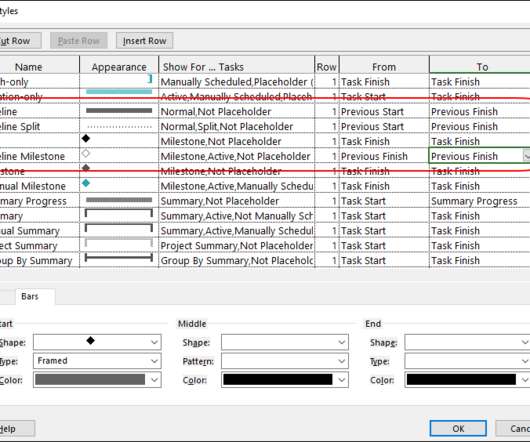
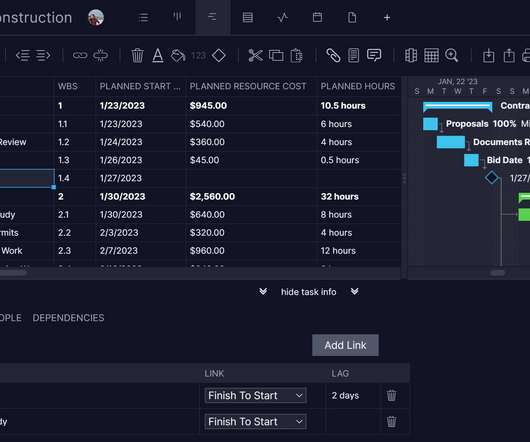
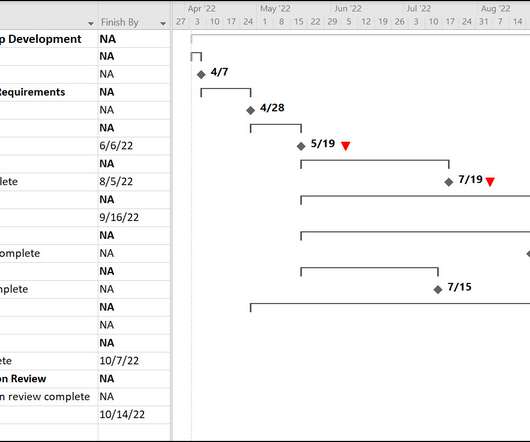
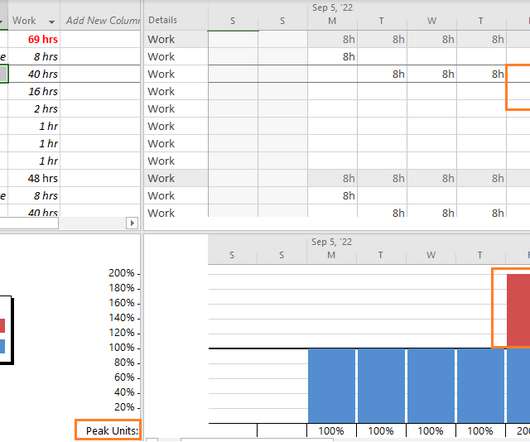
Displaying images or pictures instead of values makes it easier for you to spot project performance. Let’s look at different examples of reporting values graphically within MS Project. The Status Indicator field is the graphical version of the Status text field (i.e., Formulas with Graphic Displays.

article thumbnail

How Data Visualization Tools Can Improve Your Project Management

ProjectManager.com

Data visualization is a way to display data in a picture or graphic. As a means of communication, data visualization uses statistical graphics, information graphics and other tools for clear and efficient communications. Tufte listed what he believes all graphic displays should do: Show the data.

Insiders

Sign Up for our Newsletter

This site is protected by reCAPTCHA and the Google Privacy Policy and Terms of Service apply.

article thumbnail

What Happened to Wunderlist? 5 Wunderlist Alternatives for 2021

ProjectManager.com

That’s the value that the Wunderlist software, a well-loved cloud-based to-do list app, brought to the table. Plus, unlike Wunderlust and other Wunderlust alternatives, you can visualize your workflow with the kanban view, which displays your tasks as cards.

2021 374
article thumbnail

How To Create A Timeline In Excel (Step-by-Step Tutorial & Template)

Teamweek

A graphical timeline is a powerful tool to visualize the schedule. These include: Excel SmartArt Graphics Excel Scatter Charts Excel Timeline Templates. SmartArt Graphics Timeline In Excel. Then select Basic Timeline from the Graphic options. You may also choose other Graphics templates that suit your needs.

article thumbnail

How to Add Projects in LinkedIn: A Step-by-Step Guide

Rebel’s Guide to PM

What’s the value of adding projects to your profile? From initiatives you led as part of your volunteer experience to linking to your digital portfolio as a graphic designer, you can add pretty much anything. The downside of how it appears on your profile is that it is not displayed alongside your role in the experience section.

2009 341
article thumbnail

5 Ways To Use Visual Project Management

Rebel’s Guide to PM

Visual project management is simply using graphics, pictures, graphs and charts to display project information. And at the same time, making it easier for everyone else to grasp complex ideas through simple graphics. Basically, the web is changing from a text-based environment to one with many more visuals, graphics and videos.

2010 284
article thumbnail

How Much Time Do I Have Before My Task is Late in Microsoft Project?

MPUG

One benefit of using Deadline dates is that Microsoft Project displays a green arrow symbol in the Gantt Chart pane on the date specified as the Deadline date. I would also like to display a graphical indicator to graphically display this information. Creating the Custom Field. Figure 4: Formula dialog.

Closing 59